TECHNICAL ANALYSIS TWITTER (TWTR)
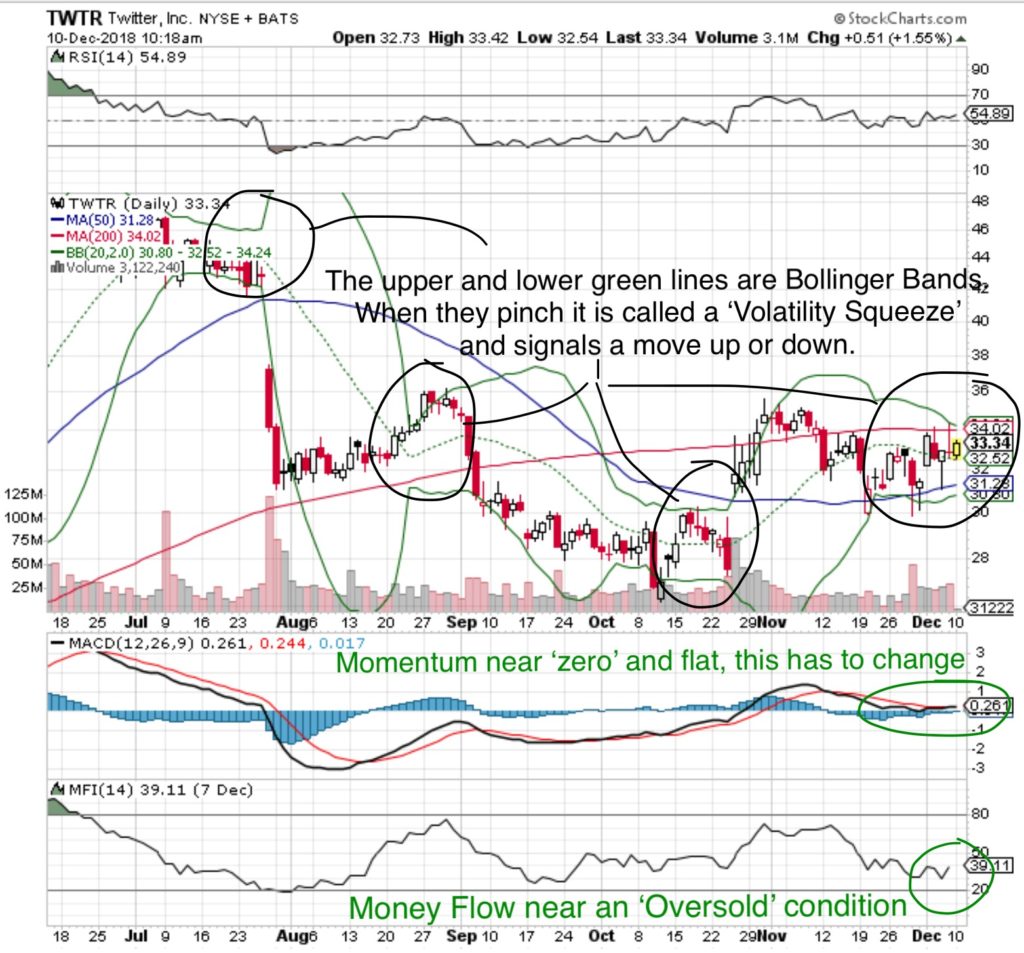
- Twitter has been trading within a tight range and is setting up for a ‘Volatility Squeeze’.
- The stock has largely been unaffected by the broader market pullback.
- Technical Indicators suggest a
near term move.

Money Flow is near neutral. 80 is considered ‘Overbought’ and 20 ‘Oversold’.
Momentum – has been in a shallow downwards trend and is currently near the ‘ZERO’ line. Momentum has to choose a direction. A rise above ‘ZERO’ would be a confirmed ‘buy signal’.
Volatility Squeeze – the upper and lower green lines in the circles pinch closely together immediately before a significant price move, either up or down.
Price Channel – TWTR has traded within a price channel defined by $31 and $34.
Technical Support – is established at $31.
Price Target 1: could be extended from an initial $36 to $41.
Why did the stock price not pull back?
Major tech stocks such as Apple, Amazon, Facebook, Google we’re subject to 20-30% stock price pullbacks, yet Twitter maintained its price. This reflects an underlying strength in the share price.
Advertisements are not subject to US federal Interest Rates or US/China trade war tariffs.
There is a theory that TWTR could be the subject of a takeover by google to directly increase it’s social media advertising exposure. This is possible as Google has $100B cash on hand.
What does that mean at MONEYWISEHQ
TWTR’s Investment Thesis remains valid and the underlying strength during the most recent pullback is interesting.
The stock is set up for a volatility squeeze and a move either up or down, but it won’t stay in the current range for long. With a low Money Flow indication and a near ‘ZERO’ Momentum Indicator, the direction could be upwards.
Downside risk is defined at $31 with upside reward initially to $36 then potentially $41.
Maintain a disciplined ‘Stop Loss’ near $30.

