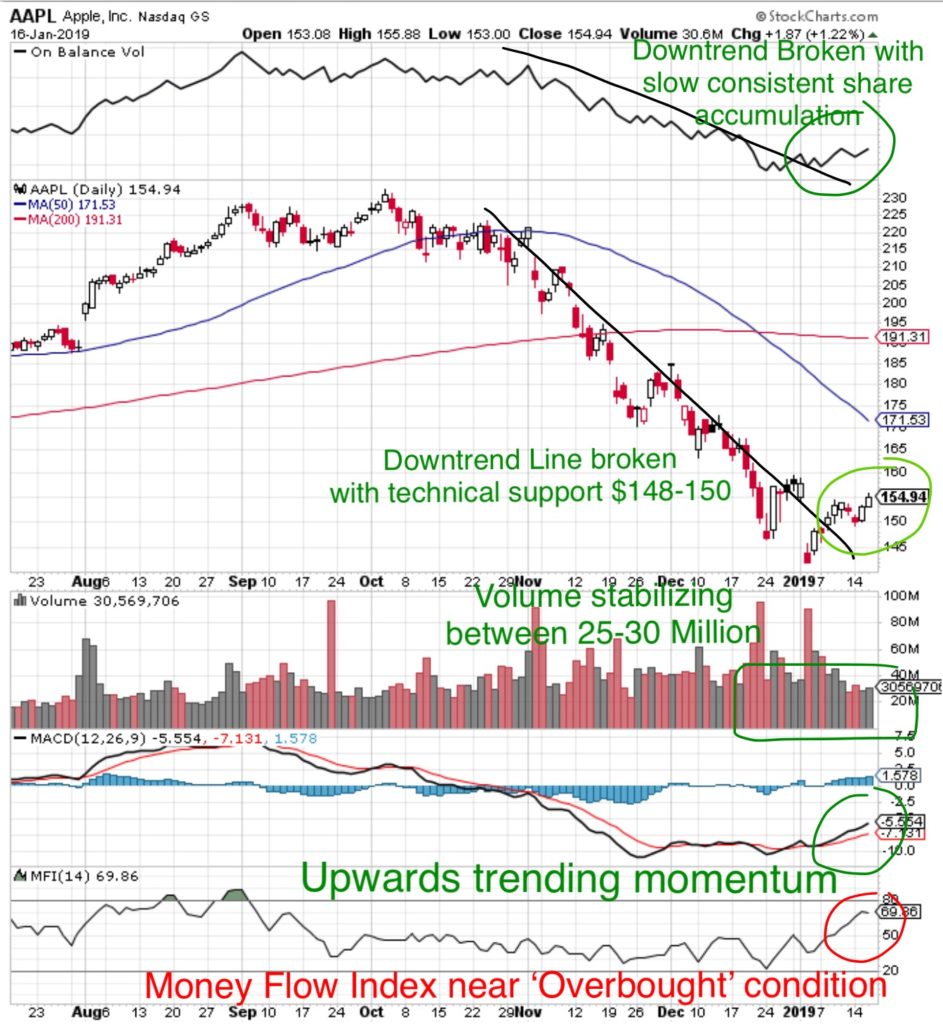
- Apple’s chart is looking very constructive in the formation of a basing pattern.
- The four elements we are watching for to indicate a reversal have taken place.

1. Money Flow Index: (20 is Oversold, 80 is Overbought): at 69 the index reading is high, however there is a little more room to the upside. It also has to be considered that the index may be skewed due to the extremes of the December selloff.
2. MACD Momentum: has turned upwards from a slowly rising trend. This is the first indication of a Buy Signal.
3. Volume: has stabilized between 25-30M shares traded per day reflecting that the High Frequency Trading programs have slowed.
4. On Balance Volume (accumulation/distribution): the downtrend distribution has been broken and shares are being slowly accumulated in a consistent, steady manner reflecting stabilization.
5. Price: has broken the downtrend line. A pullback and retest was expected and occurred near the $150 area, however it was a weak retest. The price may establish a range between $150-$160 or breakout above $160.
Technical Support: $148-150
Technical Resistance: $160
TARGET 1: $170
What does that mean at MONEYWISEHQ
AAPL reports earnings between January 29, 2019.
Earnings season market action follows one of three patterns
- Stocks run up in anticipation of strong results, then selloff when earnings don’t meet high expectations.
- Stocks remain neutral until the release then either move up or down based on the actual results
- Stocks decline as a selloff due to uncertainty of the results, then climb when results are not as bad as expected.
It’s important to take a look at the technical analysis of each of the stocks in the portfolio and compare them against those three patterns, taking a defensive strategy to protect the recovery gains recently made.
The next ten days will determine the pattern, it’s important to be prepared if an opportunity presents itself.
The Supply/Demand equation will determine stock price in the near term.
Supply
In determining downside risk, the largest consideration has to be given to the number of shares which could be dumped on the market (Supply) to force the share price down by short sellers. The high On Balance Volume (OBV) reading in October reflected shares had been accumulated and readily available as ‘supply’ in the supply/demand price equation. This was a perfect short sellers setup. However, the current (OBV) January indication is recovering from a high level of selling and shares have not been accumulated aggressively reflecting limited ‘Supply’.
Demand
There are four powerful catalysts over the next six weeks
- Earnings report due January 29
- Buyback blackout period ending January 31
- US/China trade negotiations January 31
- March 1, 2019 Trade War deadline.
Apple has consistently been repurchasing shares at the rate of nearly $20B every three months. Since mid December the company has been restricted due to the buyback blackout period (5 weeks) prior to earnings. The stabilization in share price reflects that investors are supporting the stock price (Demand) not Apple. The Buyback Blackout period will start again in mid March, leaving only 6-7 weeks for Apple to repurchase $15-$20B of shares.
Consider, in the Apple Earnings Pre-announcement video Tim Cook expressed that he receives near real time information on the trade discussions. When that buyback blackout period ends, it is possible that Apple will aggressively accumulate their own shares, however a pullback within the 48 hours after the earnings release is possible if guidance is weak.
When evaluated against the Supply/Demand equation the potential for increased demand exceeds the potential supply.
Apple has the most to gain in a resolution to the US/China trade war and that makes it extremely difficult to bet against long term given the trade war deadline of March 1. January 17, there was a rumour that the US was considering reducing tariffs on Chinese imports, which was followed on January 18 by a trade offer by the Chinese. The market reaction was significant and reflects just how quickly the recovery will be.
However, the damage done to Apple’s reputation and possible market share through indirect boycotts over the past three months could take a long time to repair.
When the company reports earnings on January 29, they will already be 30 days into the quarter and will have a good indication of current and forward sales guidance. The earnings Pre-announcement already removed the uncertainty around the actual results, guidance will determine the next price move.
Strategy:
1. accumulate shares between $148-155. Place a disciplined Stop Loss near $147. Repurchase shares near $142 with a Stop Loss near $140.
2. Accumulate shares on a breakout above $160 with a Target 1 Price of $170.
Technical Resistance occurs at a price where Big Money managers feel the stock is over valued or where previous buyers at that price just want their money back. At a current multiple of 11x earnings Apple is considered a ‘cheap’ stock. The selling has been so severe and forced hat anyone who purchased Higher has likely been flushed out. This leaves little resistance on a recovery.
Note: all other pullbacks have taken nine to twelve months for a stock price recovery which would correspond with the release of the next generation iPhone in September, 2019. Between now and then the stock price may trade within a range.

