- Trump extends Tariff deadline indefinitely, Apple develops a credit card initiative with Goldmand Sachs and announces a special event For March 27.
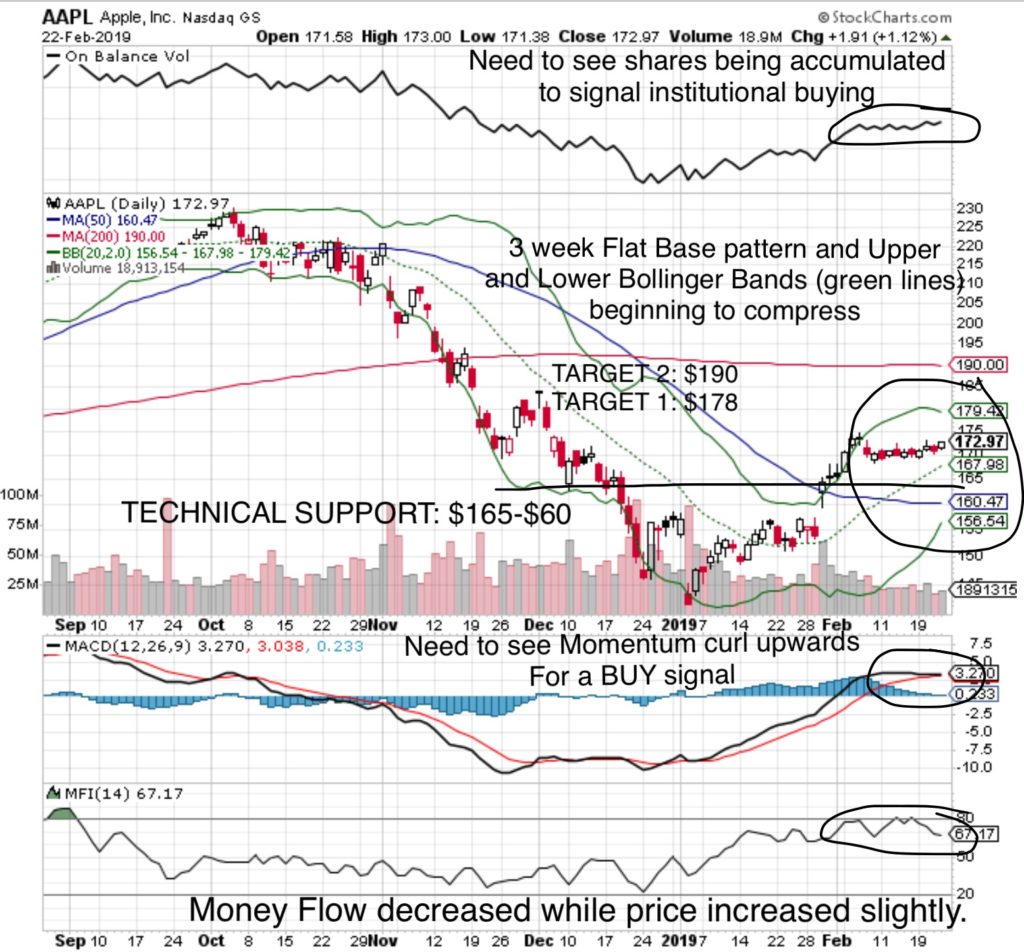
- The Flat Base pattern continues to develop and pressure will build on the stock to make a move.

Money Flow Index (80 is Overbought, 20 is Oversold): 67 has come off on an Overbought Level with a downwards trend over the past week even thought the price increased incrementally from $170 to $172.
MACD Momentum: has remained flat. Need to see this indicator turn upwards for a Buy signal. The Black Line crossing below the Red Line would be a ‘Sell’ signal.
On Balance Volume (OBV indicates share accumulation/distribution): need to see OBV turn upwards to signal institutional buying which would cause the share price to rise.
Volatility Squeeze: occurs when the Upper and Lower Bollinger Bands (green lines) compress signalling an imminent price change. This compression is just starting* to occur.
Flat Base Pattern: 3 week Flat Base pattern with a tight range between $169 – $169.
What does that mean at MONEYWISEHQ
In fifteen years of following Apple we haven’t seen the stock trade within this tight of a range for this long.
Nobody wants to commit to buying, and nobody wants to sell. The greatest risk to Apple is missing out on an upside move on some form of trade war resolution or cancellation of the March 2 negotiation deadline for the proposed increase to 25% tariffs on Chinese goods.
The low trading volume indicates that the algorithm programs have not been accumulating as a set up to a large Short setup.
Flat Base Pattern: develops when a stock price trades within a tight range for at least five weeks, although the base may last longer. The price range from the high point to the low point is generally 10-15%. This reflects an underlying strength. When the price approaches the low end, Big Money Managers step in to shore up the stock and further downside is limited as general investors find value in the price.
A Flat Base Pattern generally resolves itself to the upside in an explosive move following either a catalyst or broader market rally. However, catalysts can also be negative, causing a downwards resolution.
If the stock stays within the Flat Base for another week a second pattern, the Volatility Squeeze will develop.
Assessing the downside risk is important in a volatile market. Stock price movement will be a function of supply and demand.
With the Money Flow Index at high level (but not Overbought), Momentum flat, and share accumulation flat after recovering from a low base, the level of supply in a selloff would be limited and likely viewed as a Buying Opportunity for institutional investors.
There are two imminent catalysts
- Trade War resolution
- March 27 event expected to announce an Apple streaming service free to Apple device owners.
As competitors cell phones have taken on the features of the iPhone, the streaming service will be a huge product differentiator with an installed base of over 1.2B devices as an immediate platform. Think about that for a second. Netflix has taken 7 years to attract 127M subscribers, Amazon Prime boasts over 100M subs, Apple will instantaneously have potentially 1.2B on the day of it’s release.
Additional products expected to be launched this year include 2nd Gen AirPods, new iPad, new iMac, wireless charger and a new series of Phones.
Those are a lot of catalysts and a lot of revenue drivers.
Downside Risk: $165 (3% Loss)
TARGET 1: $178 (5% gain)
TARGET 2: $190 (13% gain)
STRATEGY
- Accumulate shares at the low risk entry point near $170. Maintain a STOP LOSS sell price near $168. The range is so tight not much room has to be provided on the stop. Consider re-entering the position on a subsequent rise above $170.
- Use the Flat Base strategy, buying slightly higher then the highest point within the Flat Base range. In this case $175 and maintain a disciplined STOP LOSS sell price at the purchase price as downside risk is down to $165.
