KEY POINTS
- The economic impact of
Covid -19 on a shutdown US economy with over 16.6 million jobless claims has to be considered against the backdrop of over $8 Trillion of US Government financial stimulus. - The biggest gains are made during market trends. After a 25% rise in three weeks, the market will develop into either a ‘V’ shaped, Retest, or Trading Range recovery. Understanding each can help investors react and profit.
- Technical analysis indicates the market is at an Inflection Point. The market has risen 13% in one week, but the indicators reflect large financial institutions have not been accumulating shares.
- Earnings Season begins this week. Financials will provide the first, and possibly most accurate, indications on the state of the economy. Earnings Reports can create volatility and opportunity.
HEADLINES
- Covid-19 global cases 1.6M, deaths 97,000
- JPMorgan now forecasts economy contracting by 40%, unemployment to reach 20% in April
- Opec+ agrees to 10M Barrels per day production cut
- US weekly jobless claims 6.6M for a three week total of 16.6M
- US Federal reserve adds further $2.3T financial stimulus for a total of over $8T
- Stock market rises historic 13% in one week
- Earnings season starts with the Banks April 12
THE ECONOMICS OF FINANCIAL STIMULUS AND OIL
On April 9, the US Federal reserve announced a further $2.3 Trillion financial stimulus package at the same time the weekly jobless claims number of 6.6 million was released. On the Jobs claim alone, the market should have dropped, however the financial stimulus acted as a catalyst to drive markets higher on Thursday.
It cannot be overstated, You Can Not Fight The Fed. If the Fed wants the economy to go up, They will make it go up. But that takes time and it’s important to note that current measures are only to keep the economy on ‘life support’. There will likely be future stimulus programs aimed at restarting the economic engine.
The total stimulus package is now over $8 Trillion which reflects their knowledge of the economic impact of Covid-19. The US economy is shut down, there have been over 16.6 million jobs claims in three weeks and JPMorgan is estimating a 40% contraction in economic activity in the second quarter of 2020.
Oil is an important part of the global economy. The Opec+ agreement to cut production by 10 million barrels per day doesn’t take effect until May and has not yet been finalized. This creates ‘uncertainty’ regarding the global supply and the demand recovery equation over the next few weeks and months.
EARNINGS SEASON
Earnings season begins with the banks reporting between April 12 and 16th.
Economies run on money. Money always flows, and banks are the pipelines. These guys have the best read on the economic impacts of the Covid-19 shutdown and financial stimulus programs. Commentary from CEO’s on conference calls will drive the markets.
Earnings season can be both Volatile and profitable.
During Earnings Season stock prices follow one of three patterns
- Stocks run up in anticipation of strong results, then selloff when earnings don’t meet high expectations.
- Stocks remain neutral until the release, then either move up or down based on the actual results
- Stocks decline as a selloff due to uncertainty of the results, then climb when results are not as bad as expected.
It’s important to take a look at the technical analysis of each of the stocks in the portfolio and compare them against those three patterns, taking a defensive strategy to protect the recovery gains recently made.
STOCK MARKET RECOVERY
There are three very distinct camps of investor views on the market recovery
- ‘V’ shaped recovery – market keeps going higher
- ‘Retest’ – market pulls back
- ‘Trading Range’ – generally there would be a ‘Basing Period’ within a trading range
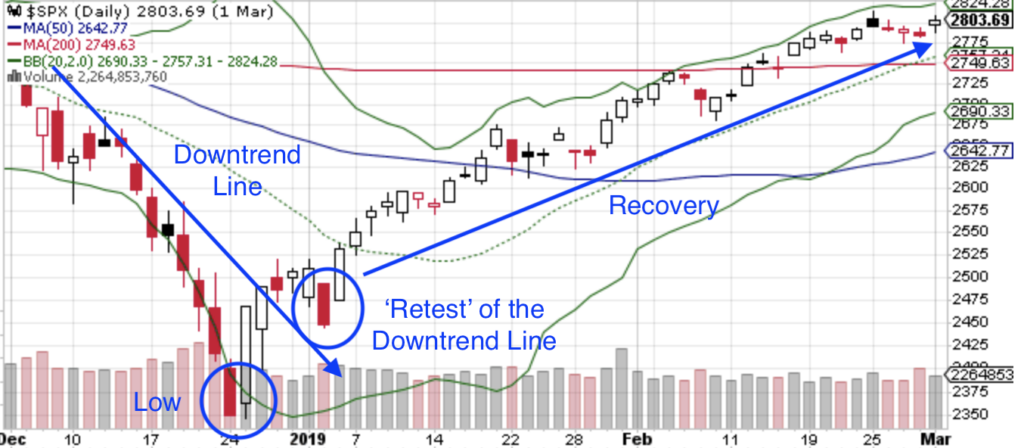
In a Recovery of any stock or broader market pullback, a key component is a ‘Low’ followed by a ‘Retest’ of the downtrend line.
In a ‘V’ Shaped Recovery, the stock, or ‘broader market’ continues in an uptrend once a resolution to the ‘Threat’ or ‘Event’ has been presented and removes ‘Uncertainty’.
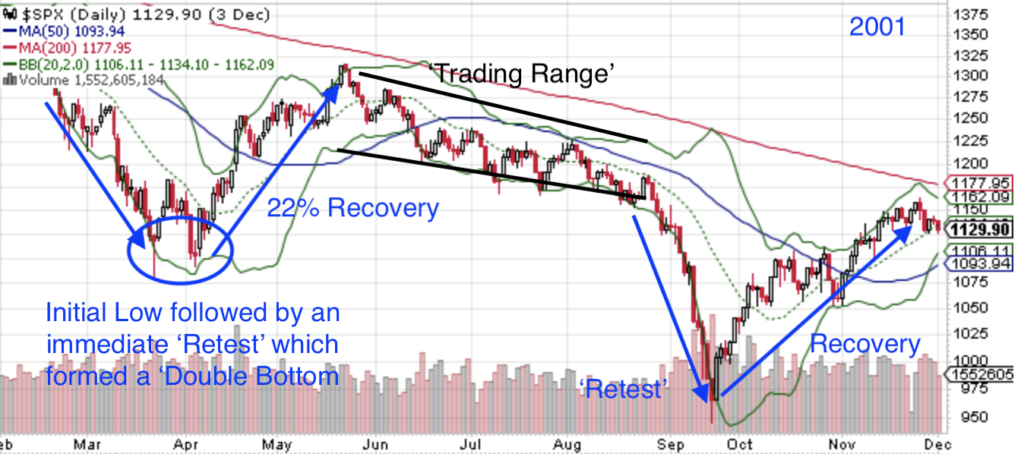
In the 2001 Stock Market crash, there was an initial ‘Low’ which was immediately followed by a ‘Retest’ which formed a ‘Double Bottom’. This is the current view of the ‘Retest’ camp.
However, note that after a 22% increase in April/May, the market entered a ‘Trading Range’ followed by a much larger pullback to ‘Retest’ (and subsequent failure) of the April Low before the market formed the final Low and began the recovery process.
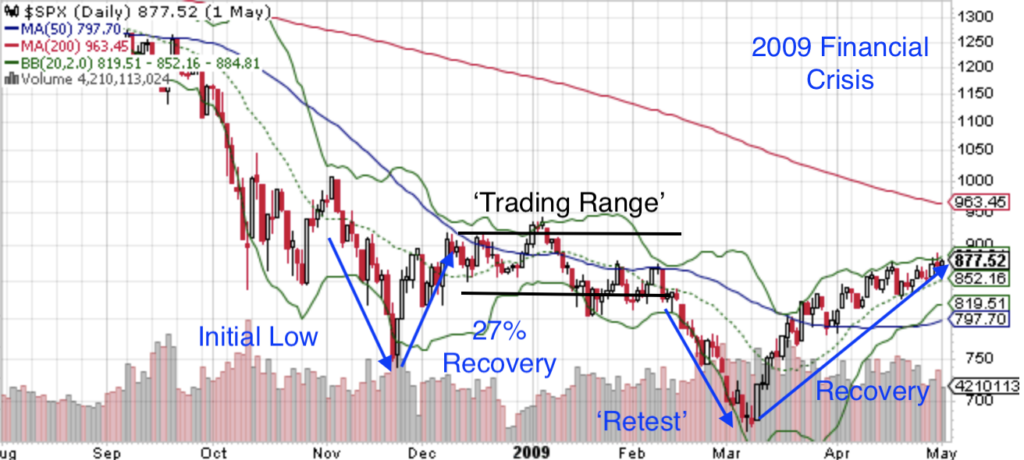
In the 2009 Financial Crisis, the market recovered over 25% from the ‘Low’.
A ‘Trading Range’ was entered which lasted two months before a larger pullback to a ‘Retest’ (and subsequent failure) of the initial November low before the market formed the final Low and began the recovery process.
I would highly recommend watching the following video of market strategist Tony Dwyer.
I would also highly recommend watching the following interview with market technician Helene Meisler in which she discusses the market overbought levels and
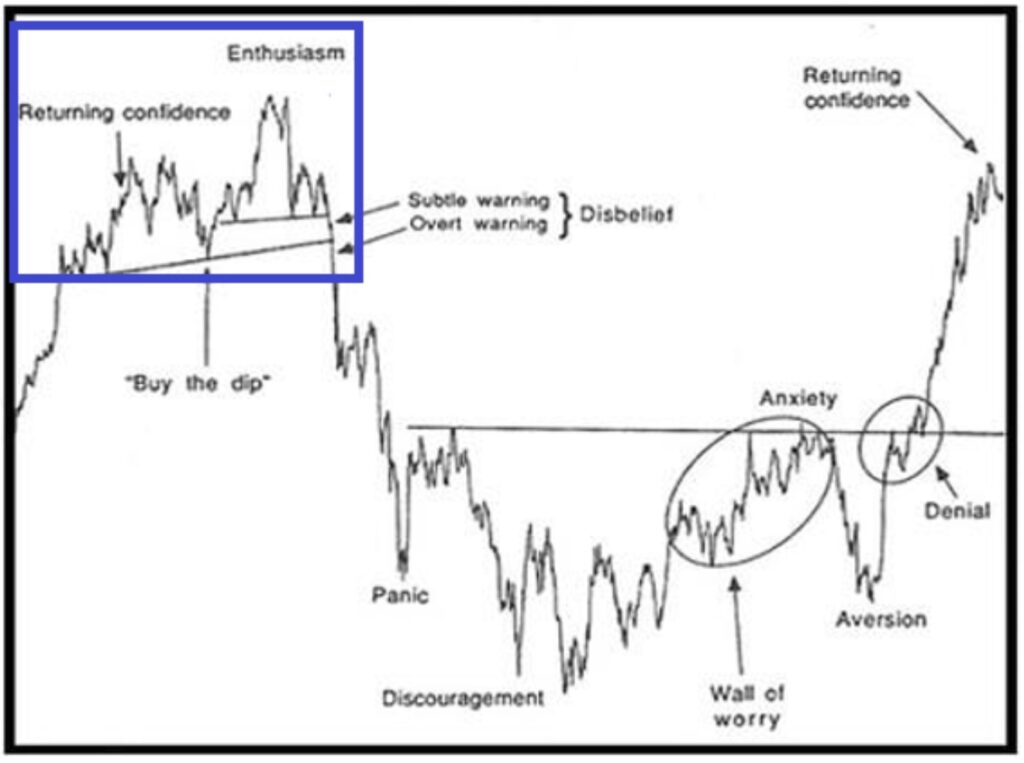
The market sentiment model is very broadly understood by market Strategists and Technicians.
In the Market Update March 15
The economic collapses of 2001 and 2009 both reflect the market Sentiment Model pattern. The 2019 collapse saw a ‘V’ shaped recovery on concerns of a possible recession, however the recession did not materialize at the time.
TECHNICAL ANALYSIS
Volatility Index (www.stockcharts.com ticker $VIX)
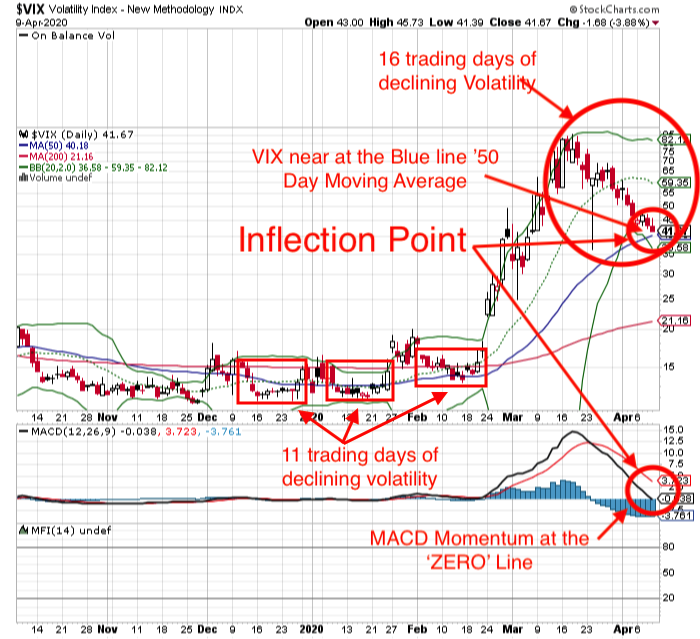
The Volatility Index is generally referred to as the ‘Fear Guage’ and is a mathematical ratio of the number of ‘Put Options’ (bets the market will go down) divided by the number of ‘Call Options’ (bets the market will go up). The higher the number of ‘bets the market will go down’, the greater the ‘Fear’.
At an index level of 41, there has been a reduction in ‘Fear’, or the number of bets the market will go down, but it is still very high even though the market has rallied over 13% in one week and a total recovery of over 25% in three weeks.
This reflects four uncertainties
- duration of
Covid -19 - impact on the economy and effectiveness of
financial stimulus plans - Oil Prices
- The ‘V’, ‘Retest’, or ‘Trading Range’ market direction
The VIX has been in a downtrend for 16 days, reflecting a level of stability. In general, the longer the period of stability the more significant the move that can be expected. Compare this with the three periods of stability in December, January, and February, each of which lasted only 11 trading days as well as the October through December period which lasted 30 trading days.
The VIX is currently at an ‘Inflection Point’ of two important indicators
- 50 Day Moving Average (blue line on the chart)
- MACD Momentum at the ‘Zero Line’
These ‘Inflection Points’ would generally cause a market movement. A continuing decline in both would signal the continuation of a market uptrend. A bounce and subsequent increase would signal a move down in the market into a Trading range or possibly a Retest.
MCCLELLAN OSCILLATOR (www.stockcharts.com ticker $NAMO)
The McClellan Oscillator reflects ‘Overbought’ and ‘Oversold’ conditions.
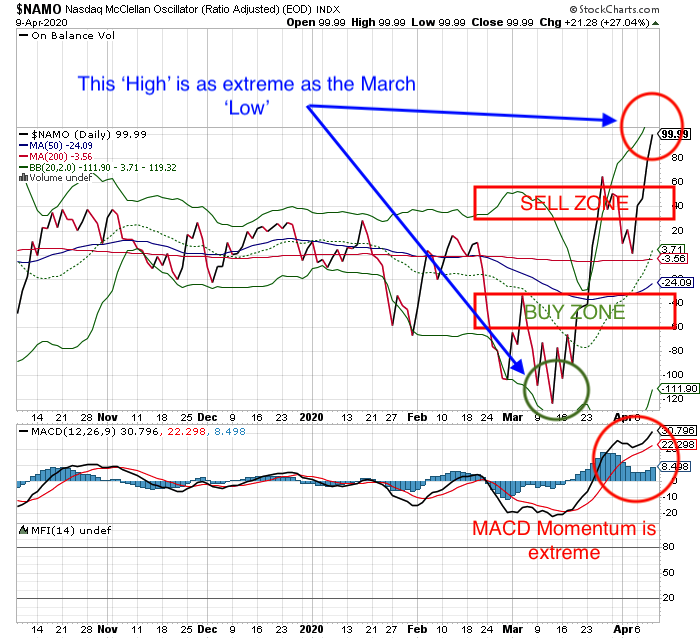
It’s important to note that the oscillator works on a
The market moving up 13% in one week is as extreme as the market having moved down 13% in one week in March.
S&P500
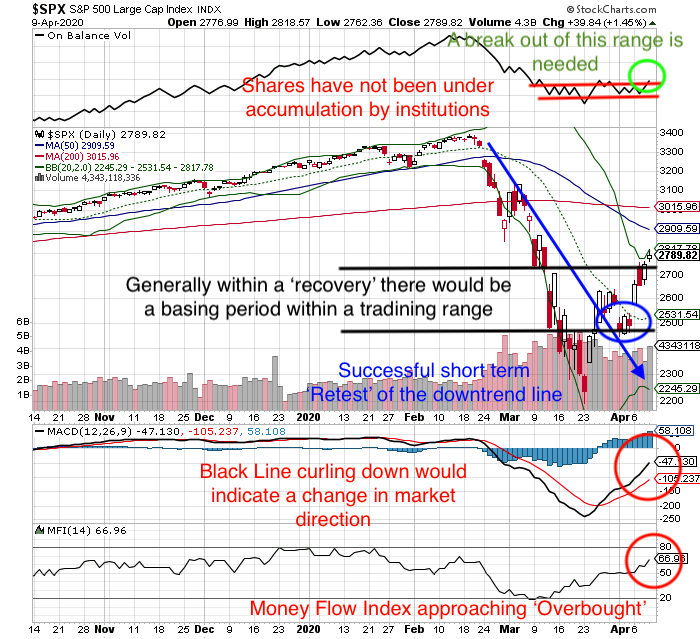
Money Flow Index (80 is ‘Overbought’, 20 is ‘Oversold) Current 67: This is approaching an ‘Overbought’ condition which warrants caution. There is still room to the upside for further broader market gains but it may come as a result of ‘laggards’ rising, rather than ‘leaders’ continuing their march higher. Once 80 is reached, there is a high probability of a reversal.
On Balance Volume (OBV) (indicates institutional accumulation of shares): This is an important one to note. Notice that even though the broader market has increased by 13% in one week, shares have not risen out of a tight range, this reflects that large financial institutions have not been accumulating shares. A breakout above this range would signal the market will move up. However, it is important to note, the general strategy of Big Money Managers is to sell into strength when the broader economic conditions are weak.
MACD Momentum: This is in an uptrend. The black line curling downwards would be the first signal of a change in market direction.
what does all that mean at moneywiseHQ
moneywiseHQ RULE #1 – “A good investor has to be aggressive to make money, but if you don’t have a good defensive strategy, you won’t keep your money.”
The biggest profits are made by following the trend, that may be up (V Shaped Recovery), down (Retest) or the market may enter a Trading Range. The market is currently at an Inflection Point of a new trend. It’s important to be flexible and react to the market movement, rather than trying to anticipate it, while maintaining a defensive strategy in the event the market doesn’t move in the expected direction.
Well regarded Strategist, Tony Dwyer, and market technician Helene Meisler have presented the market views of Big Money Managers which reflect the traditional Market Sentiment Model. Those views have to be considered against the backdrop of unlimited Federal economic stimulus which could cause a ‘V’ shaped recovery.
When we invest in a stock we look for three components
- Best in Class
- Secular Growth Trend
- Strong Macroeconomic Environment
This is also the strategy of Big Money Managers. If one of those three components is not there, they won’t invest and will use market strength to sell, especially in a weak macroeconomic environment. They also look forward three to six months and the short term weak economic data (1-3 months) has to be considered against the long term recovery (
The Technical Analysis reflects the Volatility Index is at an ‘Inflection Point’, The McClellan Oscillator is at a short term ‘Extreme’ level (above the ‘Sell Zone’) and the S&P500 has moved a historic 13% in five days but the On Balance Volume reflects shares have not been under accumulation by large institutions.
There is no crystal ball to know what direction the market will move, we can only look at where it has moved from, understand how Big Money Managers think, consider the macroeconomic environment and look at the indicators to see what they have actually done – and then be prepared to react, not anticipate.
When the market shifts from a Buy and Hold environment to a Trading Environment, consider the following strategies and take note of the Exit and Defense strategies as they apply in all investing environments.
TRADING AROUND A CORE POSITION (click for link)
TRADING IN A HIGH VOLATILITY MARKET (click for link)
For those interested in shorting the market or learning how short sellers work please read
PROSHARES SHORT S&P500 (click for link)


