In the moneywiseHQ MARKET UPDATE 10-04-2020 REACT, DON’T ANTICIPATE (click for link), we noted the market was at an inflection point and would follow one of three recovery types, with the Trading Range followed by steeper pullback being the traditional pattern
- ‘V’ shaped recovery
- ‘Retest’ recovery
- Trading range recovery
By looking at individual stocks within the portfolio we can better assess the future direction of the market.
As we look at the portfolio stocks, we are starting to see some separation. Financials (V) and industrials (DE) have started a short term pullback, technology (FB) and healthcare
This is really important, because on a broader pullback what we don’t want to see is unrelated sectors all pulling back equally (or in correlation). What we want to see is stocks decline in three waves starting with the most susceptible to a threat first, then cascading through to the strongest stocks at the end. This makes for a predictable and stable decline or entry into a trading range.
For reference we use three primary indicators throughout the Portfolio Update
Money Flow Index (80 is ‘Overbought’, 20 is ‘Oversold’) at the ‘Overbought’ or ‘Oversold’ level there is a high probability of a price reversal.
MACD Momentum: indicates the price momentum. The ‘black line’ crossing over the Red Line is a ‘Buy Signal’. The ‘Black Line’ crossing below the ‘Red Line’ is a ‘Sell Signal’. The MACD crossing above the ‘ZERO’ line is a buys signal confirmation. The MACD crossing down below the ‘ZERO’ line is a sell signal confirmation.
On Balance Volume (OBV) indicates if financial institutions are accumulating or selling shares.
Technical Resistance and Technical Support define the risk/reward for any stock.
Technical Resistance: The price level that an uptrend can be expected to stop, or pause temporarily, where investors consider the stock to be fully valued and start selling shares.
Technical Support: The price level that a downtrend can be expected to stop, or pause temporarily where investors consider the stock to be undervalued and they begin buying shares.
TECHNOLOGY
FACEBOOK (www.stockcharts.com ticker FB)
Facebook Reports 1st Quarter Earnings April 29, 2020.

Facebook has been the laggard in the tech led FAANNG (Facebook, Apple, Amazon, Neflix, Nvidia, Google) recovery.
In theory, during weak economic times, advertisers look for the most cost effective method to reach customers and generate sales revenue. Facebook has over 2.2 Million active users and an advertising platform which specifically targets the individual. During the period of ‘Social Distancing’ or Shelter-in Place’ restrictions, facebook and it’s associate apps whatsapp, instagram and messenger will be playing a role in keeping people together.
There are two concerns which may have been holding back the stock.
- Lower advertising prices – prices are based on an ‘auction system’ where advertisers bid on page views. With Shelter-in Place restrictions, people aren’t able to shop, advertisers may be reducing advertising volume, or reducing budgets, which lowers prices.
- Politics – There are lingering issues over privacy and regulation. However, these were not a concern for investors when the stock price traded at $220 only six weeks ago.
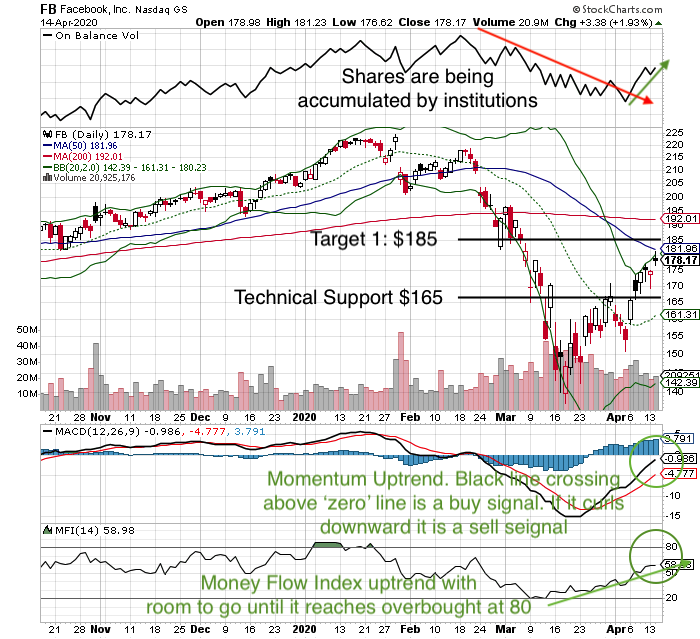
Given the concerns, FB will likely lag the other FAANNG stocks upwards and possibly lead on any price reversal. In the short term this stock is in an uptrend, has room to move up before it is considered ‘Overbought’ and shares are being accumulated by institutions. That could change very quickly in a volatile market
Strategy: Price Target 1 (upside reward) is $185, a break above this level could see shares climb to $200. Technical Support (downside risk) is $165. Maintain a ‘Trailing Stop Loss’ sell order as prices rise to protect recent gains. for a more conservative approach, consider trimming shares between $180-$185 with the view towards repurchasing on a breakout above $185 or a pullback to $165.
FINANCIAL
VISA (www.stockcharts.com symbol V)

Visa is expected to release earnings April 22, 2020. Analyst estimates are for quarterly revenue of $5.8B, up 5.6% from last year, and Earnings per Share of $1.35, an increase of 3.1% from last year.
On Wednesday April 15, 2020 an analyst downgraded both Visa and Mastercard from Buy to Hold. Visa stock price dropped 5%, which is a normal short term reaction to a downgrade, but may also be combined with weak bank earnings reports this week.
Visa is a financial sector company, but it is not a financial institution. Visa generates revenue by being the middle man between the user, the business selling goods and the bank which has issued the card and provides the actual loan. Effectively they are the tollbooth in the money flow pipeline and have three primary streams Services Revenue (they get a percentage of every purchase), Data Processing Revenues (fees they charge for maintaining their network), and International Transaction Revenues (cross border and currency conversion activities).
There are some concerns investors may have going into earnings resulting from the Covid-19 pandemic.
- Lower International Transaction activity. Airfare, hotel and restaurant spending are
high value international purchases. These activities have effectively beenshutdown . Volume of purchases made by consumers may have declined because public shopping on a daily basis has declined.
These effects are partially offset by the requirement for consumers to purchase online, which requires the use of a credit card. In the long term, Visa will benefit from the accelerated secular trend towards online purchases caused by the
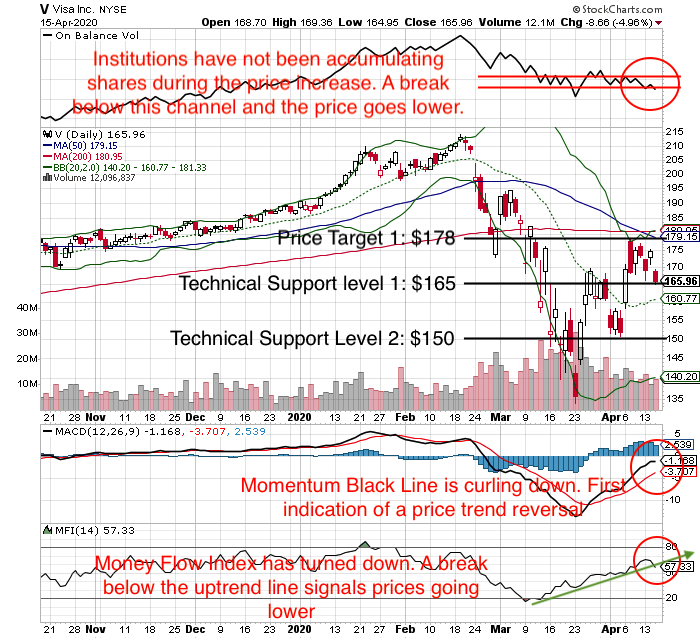
What’s very interesting in the charts is that Big Money Managers (Institutions) have not been accumulating shares, even thought the broader market has rallied and the stock price has risen. Technical indicators reflect the first indication of a possible price reversal and the stock price is currently right at a Technical Support level of $165.
Strategy: Price Target 1 (upside reward) is $178. Maintain a disciplined STOP LOSS strategy near $164. If the stock price drops below $164 there is a high probability it may drop to Technical Support Level 2 at $150. The stock will enter a trading pattern, it may take some time for that to develop.
INDUSTRIAL
DEERE (www.stockcharts.com symbol DE)

Deere is expected to release earnings quite late in the earnings season, May 22, 2020.
Globally farm equipment shows occur January through March, many of which were cancelled due to the Covid-19 virus. This affects Deere’s sales. Plants have been shut down and some have even been converted to mask making operations.
Depending on ground conditions (and region), planting season typically occurs mid-
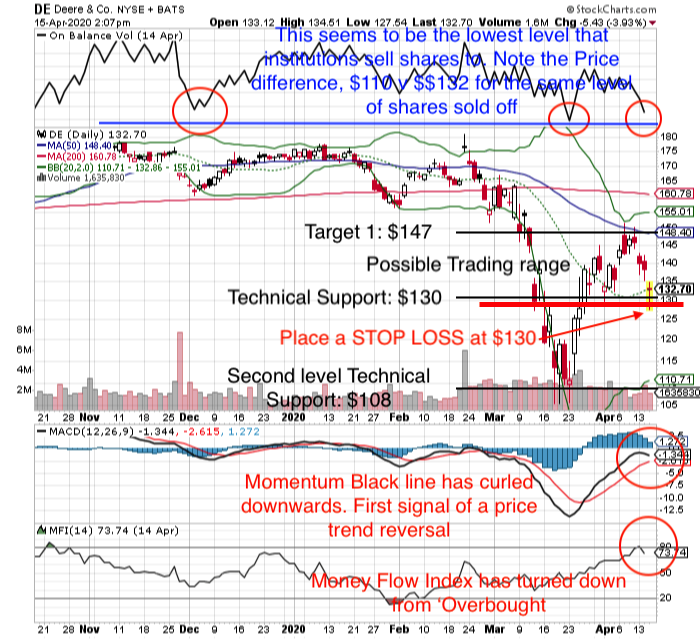
What’s very interesting in the charts is that Big Money Managers (Institutions) have not been accumulating shares, even thought the broader market has rallied and the stock price has risen. Technical indicators reflect the first indication of a possible price reversal and the stock price is currently right at a Technical Support level of $130.
Strategy: Price Target 1 (upside reward) is $147. Maintain a disciplined STOP LOSS strategy near $127. If the stock price drops below $127 there is a high probability it may drop to Technical Support Level 2 at $108. If the stock enters a trading range between $130-$147, Trading Around a Core Position (click for link) would be effective.

