TECHNICAL ANALYSIS APPLE (AAPL) 12/1/19
- Apple is following the expected pattern and conditions
- Waiting patiently for a reversal confirmation while maintaining a defensive strategy will lead to an eventual opportunity.

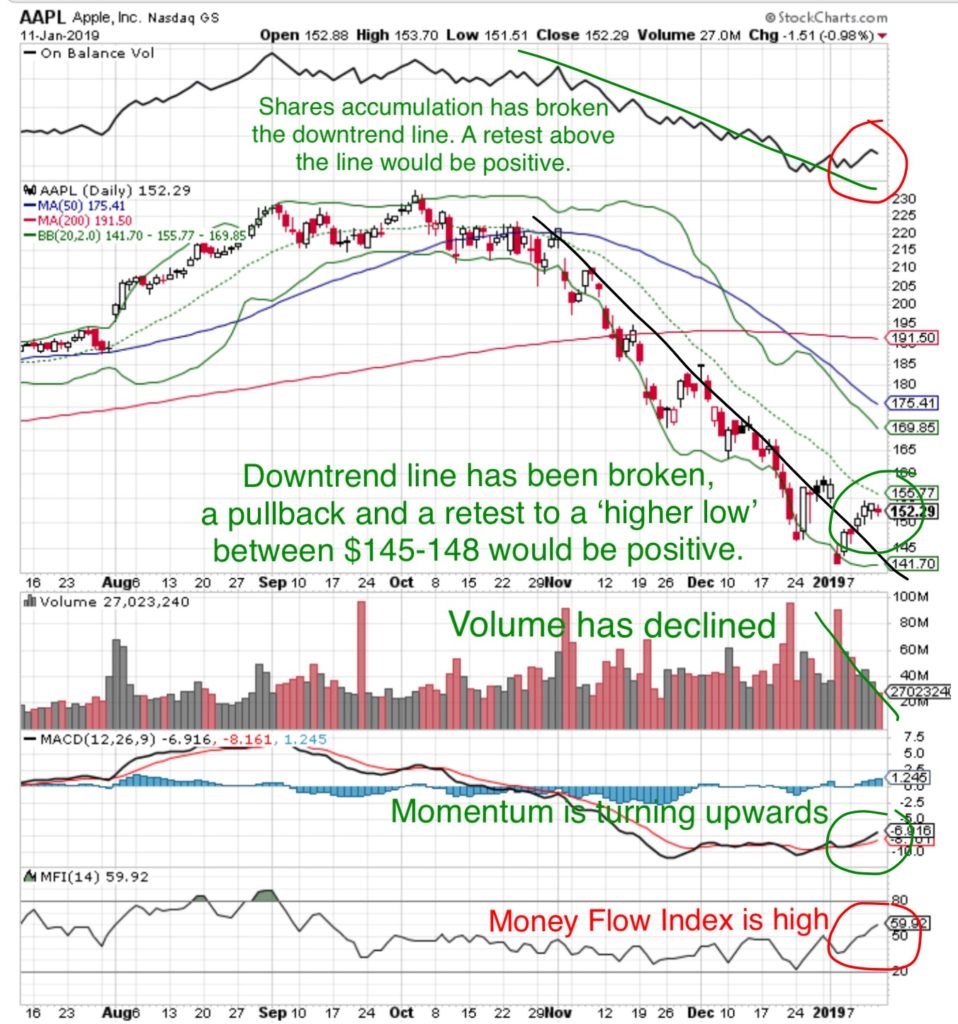
Money Flow Index (80 is ‘Overbought’ 20 is ‘Oversold’) – near 59, the stock is near ‘Overbought.
MACD Momentum has turned upwards.
On Balance Volume (share accumulation/distribution): shares have broken the downtrend line and have begun to be accumulated. Generally there would be a ‘retest’ downwards with the downtrend line acting as ‘support’.
Trading Volume: has decreased. This reflects lower algorithmic program trading. Sellers are less reluctant to sell and buyers are less willing to buy as the supply/demand equation builds towards equilibrium. This is part of the stabilization process.
Price: the stock price did not decline despite the negative earnings per-announcement. This is positive. The price has broken the downtrend line. Generally there would be a pullback and a retest of that line in the $145-$148 range.
What does that mean at MONEYWISEHQ
There were four patterns required to signal a reversal
- Reducing volume : reflecting less algorithm program trading
- Increasing Money Flow Index
- Share accumulation breaking the downtrend
- Price breaking the downtrend
These have all occurred.
There are three items which should confirm stabilization and a reversal
- Trading volume averaging between 25-30 million shares.
- increasing Share accumulation
- Price pullback to retest the top of the downtrend line at $145-148 as a ‘higher low’ followed by a price increase.
Apple Reports earnings January 29- February 4. The Pre-Announcement Analysis should be reviewed, this has taken away a significant amount of uncertainty between now and the report.
If the share price was going to have pulled back, on the earnings per-announcement, below the prior low of $142, it likely would have done so as the Big Money Managers put the numbers into their price models.
Generally after breaking above a downtrend line, the price would pullback to above that level ($145-148) and hold that price.
We would also look for some rotation out of the stocks that have recovered in the first wave moving money into the second wave.
There was an article the day after Cramer’s very positive interview with Apple CEO Tim Cook which expressed Apple had cut iPhone production orders by 10%. That disconnect adds some uncertainty on managements credibility.
Stock price movement leading up to Earnings reports follows one of three patterns
- Stocks run up in anticipation of strong results, then selloff when earnings don’t meet high expectations.
- Stocks remain neutral until the release then either move up or down based on the actual results
- Stocks decline as a selloff due to uncertainty of the results, then climb when results are not as bad as expected.
Strategy: maintain a Stop Loss near $145. Accumulate if stabilization between $145-148 if associated with a general market pullback.

