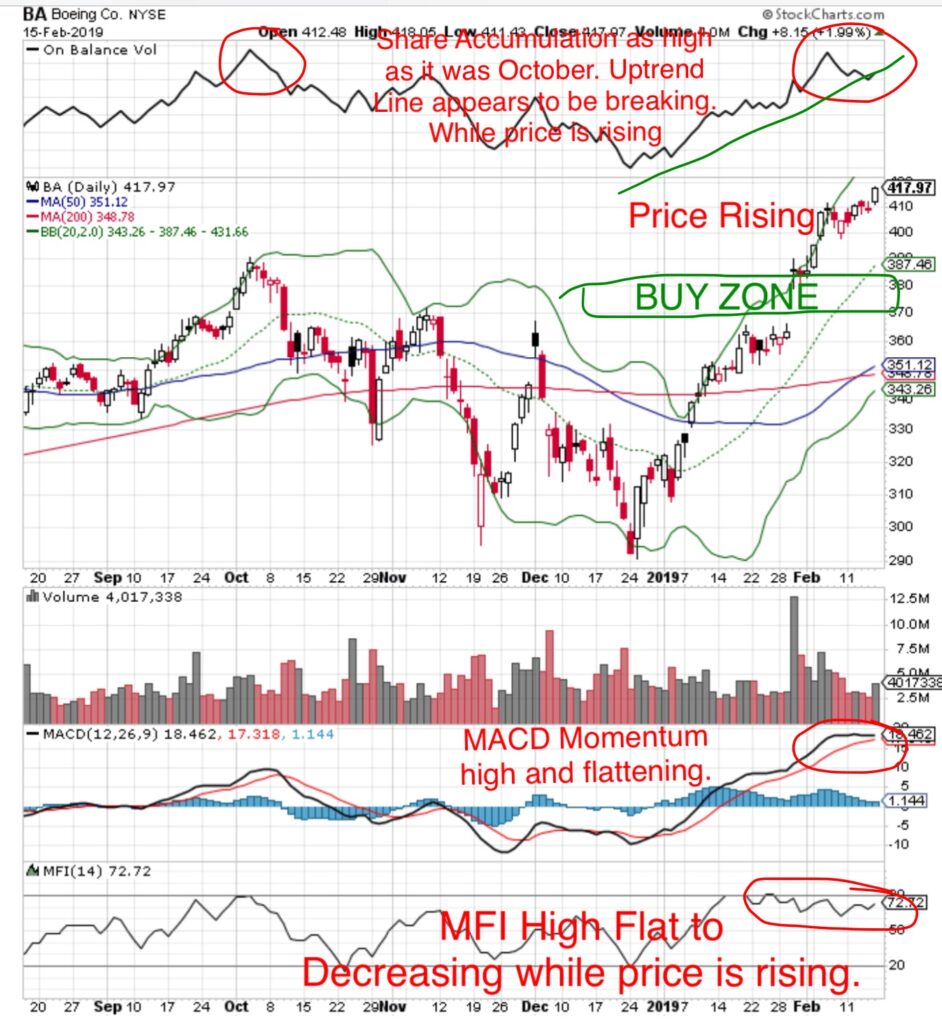
Money Flow Index ( 80 is Overbought, 20 is Oversold): 72 Money Flow has been near an Overbought Level for over four weeks. There is a divergence between the stock price increasing and MFI flat or slightly decreasing.
On Balance Volume (OBV indicates share accumulation/distribution): shares have been under an uptrending accumulation however there is a divergence with recent breakdown from this uptrend and the rising stock price.
MACD Momentum: Has been in a strong uptrend, however it has flattened which is in divergence from the rising share price.
TECHNICAL SUPPORT: $390
BUY ZONE: $360-$380
What does that mean at MONEYWISEHQ
Boeing has been one of the strongest stocks in the broader market recovery flying nearly 40%.
A market recovery occurs in three waves. The strongest stocks recover first. When these reach a fully valued level, profits are taken and the leaders are used as a source of funds rotating into strong companies which have lagged the market but offer the greatest potential upside. When these stocks reach a fully valued level, funds are rotated into the weakest of stocks.
The technical indicators reflect a divergence from the rising stock price. This could be viewed as underlying profit taking which would be in keeping with the market recovery theory.
A pullback to the ‘BUY ZONE’ would provide a buying opportunity in a ‘best in class’ industrial with an incredibly strong Investment Thesis.
