- The next driver in Disney’s growth approaches which could see Disney share price climb in the the coming months.
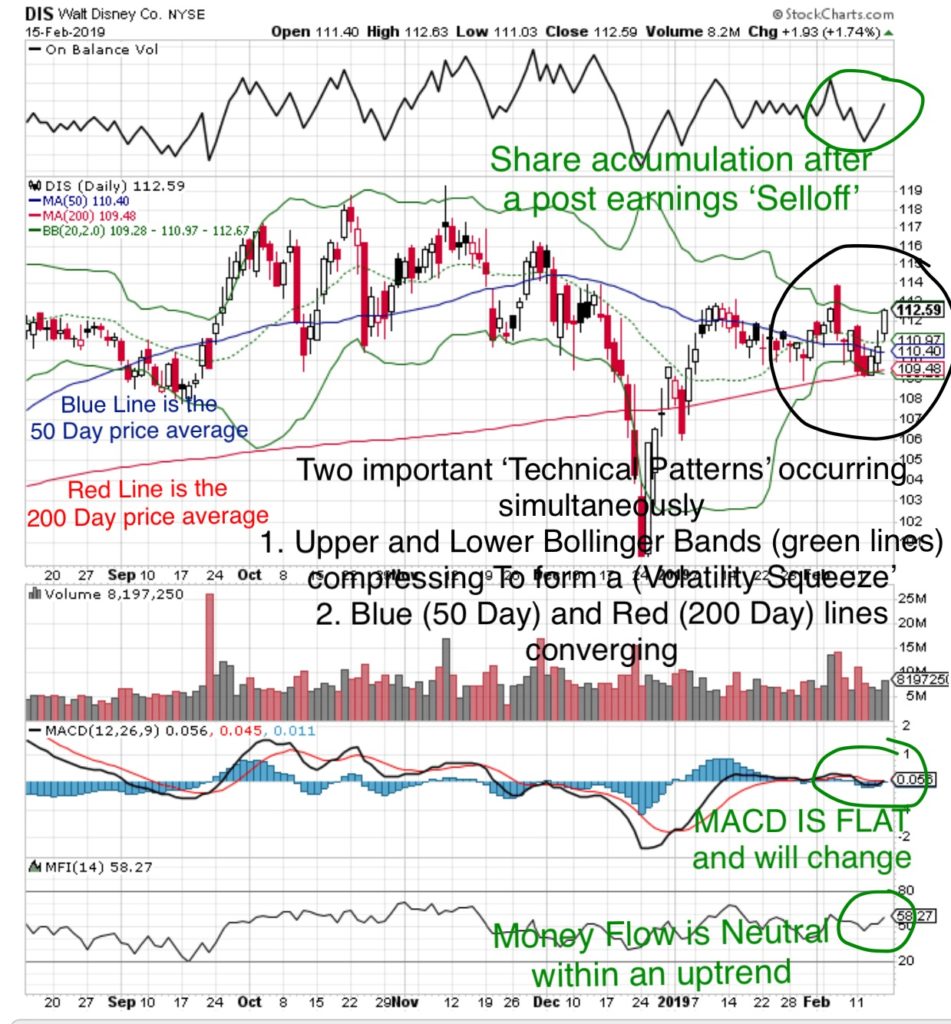
- Two important technical indicators are occurring simultaneously reflecting a potentially significant move.

Money Flow Index (80 is a Overbought, 20 is Oversold) 56 is Neutral within an uptrend.
On Balance Volume (OBV indicates share accumulation/distribution) – shares were sold off following the Q4, 2018 Earnings Report, followed by accumulation .
MACD Momentum – Has been flat hovering near the ‘ZERO’ line for four weeks. This will change.
There are two important technical indicators occurring simultaneously
- Upper and Lower Bollinger Bands (green lines) are compressing tightly within 3% forming a Volatility Squeeze signalling an impending change.
- The 200 Day Moving Average Price converging with the 50 Day Moving Average price.
Technical Support (downside risk): $109
Target 1: $120
What does that mean at MONEYWISEHQ
This stock is about to move, it just needs a catalyst.
In the Q4, 2018 Disney provided a Spring 2019 start for the Disney+ streaming service, preceded by an April 11 Investors Day which would provide additional information. The primary concern of investors is the cost associated with the Disney+ development.
This is largely viewed as the next growth catalyst for Disney. Generally, it could be expected that shares would climb leading up to the investors day.
Earnings season market action follows one of three patterns
- Stocks run up in anticipation of strong results, then selloff when earnings don’t meet high expectations.
- Stocks remain neutral until the release then either move up or down based on the actual results
- Stocks decline as a selloff due to uncertainty of the results, then climb when results are not as bad as expected.
Leading into the Earnings Report Disney was set up for a Pattern 2. The stock price remained within it’s tight range with only a 3% pullback to the Technical Support level of $109, this could be viewed as a strong underlying support.
The simultaneous occurrence of the Volatility Squeeze and convergence of the 200 and 50 Day Averages signal a powerful move.
A market recovery occurs in three waves. The strongest stocks recover first. When these reach a fully valued level, profits are taken and the leaders are used as a source of funds rotating into strong companies which have lagged the market but offer the greatest potential upside. When these stocks reach a fully valued level, funds are rotated into the weakest of stocks.
Disney has a strong Investment Thesis, combined with powerful technical indicators and an upcoming catalyst which will lead to significant revenue generation.
STRATEGY
1. Accumulate shares near Technical Support of $109 – $112. Maintain a STOP LOSS price near $108. The next Support ever is near $102. If the trade does not materialize look to re-enter the trade on a subsequent rise above $109 or accumulate shares near $102.
