- Disney closed the anticipated Fox Aquisition March xx, holds it’s Investors Day April 11 and reports earnings May 8.
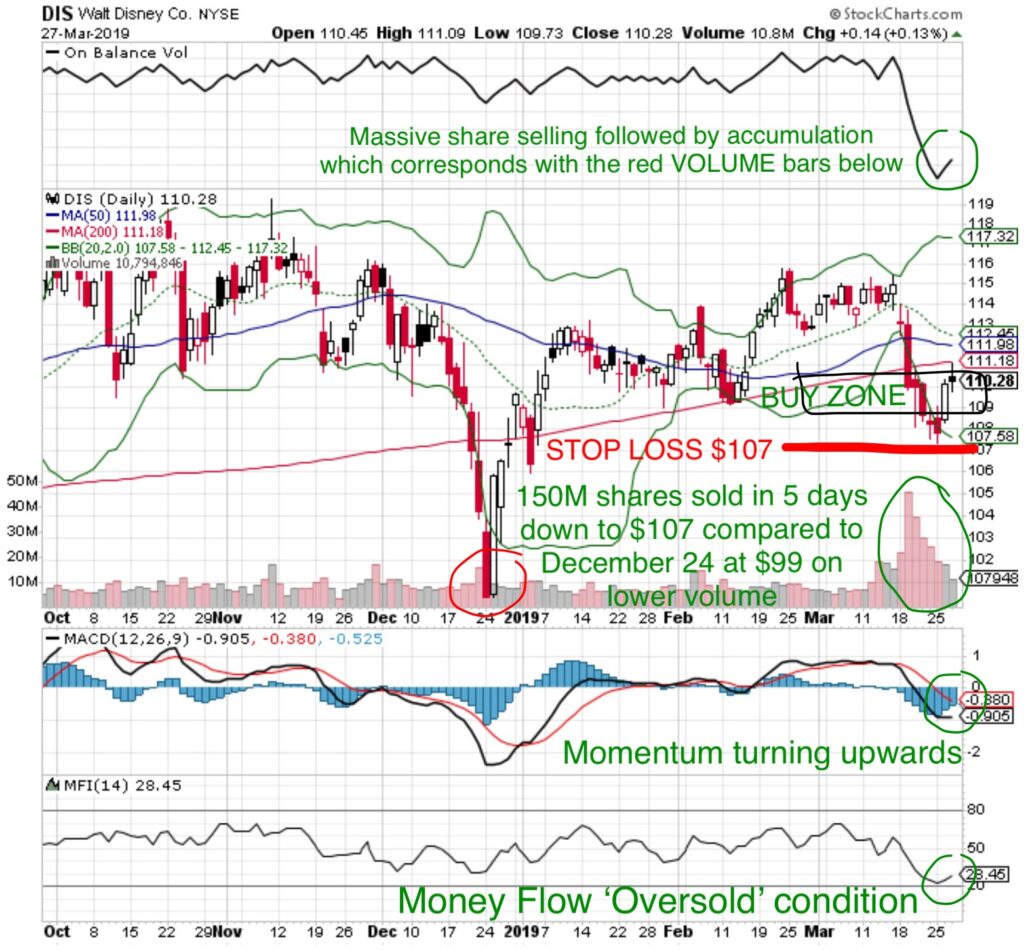
- Technical indicators are reflecting a low risk entry point for an intermediate trade or long term investment.

Money Flow Index (80 is Overbought, 20 is Oversold): 28 the stock bounced right off the ‘Oversold’ level of 20.
On Balance Volume (OBV indicates share accumulation/distribution): shares were sold off hard which is reflected by the volume.
Trading Volume: is often viewed as the polygraph of the market – 150M shares were sold in 5 trading days after the $70B Fox aquistion. This reflects one of two situations
- Short sellers were trying to drive the stock down – if this was the case, then it’s important to note that the price only dropped to $107 on far higher volume when compared to the December 24 selloff to $99. This reflects underlying institutional strength/buying – there is always someone else on the other side of a trade.
- Someone was holding a lot of stock with the Fox aquisition as a catalyst trade. When that trade didn’t materialize, they liquidated the position. If this was the case then the price support at $107 reflects institutional buying on the other side of the trade.
MACD Momentum – is starting to curl upwards which is the first indication of a BUY signal. The Black Line crossing above the Red Line would be a confirmation.
What does that mean at MONEYWISEHQ
Catalyst based investing or trading can be very profitable, but when supported by a strong investment thesis and technical indications can make for good long term investments.
Disney has two near term catalysts, the April 11 Investors Day followed by the earnings report April xx. It’s not unusual to see a stock price run up into the catalyst
The closing of the Fox acquisition expanded the Disney footprint globally which will add to revenue, but also incurred a significant debt load. The Disney+ announcement expected on April 11 is viewed as the next driver of the companies growth and investors are hoping that this service might transform the stock valuation, currently xx, more inline with a Netflix level of xx.
TARGET 1: $115
TARGET 2: $120
TARGET 3: $130 (long term)
STOP LOSS: $107
STRATEGY
- Accumulate shares in the $108-$110 range. Maintain a trailing percentage (1-3%) as price rises. Maintain a disciplined Stop Loss near $107 as the next Support level is $102. Look to re-enter the trade near $102 or a subsequent rise above $108. Monitor the price action closely near the April 11 Investor Day Catalyst.
Once the catalyst has passed, the trade has passed, and consider whether it’s viable to hold as a long term investment.
