TECHNICAL ANALYSIS DISNEY (DIS) 10/12/2018

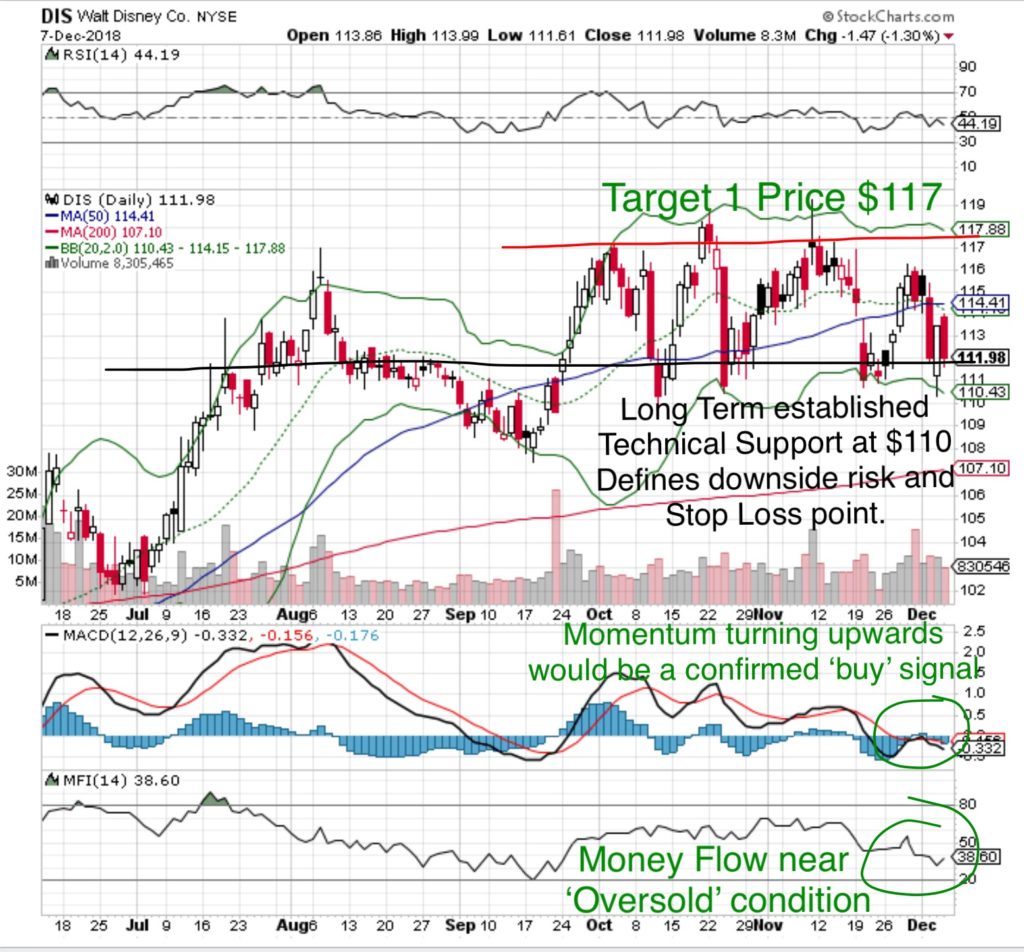
Money Flow – has been in a downwards trend and is currently at a level of 38, slightly ‘Oversold’. 80 is considered ‘Overbought’, 20 is considered ‘Oversold’.
Momentum has been in a downwards trend since early October, however notice that the stock price has not been in a downtrend.
Technical Support – is long term established near $110.
Price Target 1: $117
Price Channel – even though the Money Flow and Momentum have been trending down, the stock price has traded within a 7% channel range between $110 and $117. This reflects underlying strength when compared to other companies pullback of 20-30% during the same period.
Why did the stock price pullback?
Disney was subject to the broader stock market selloff.
What does that mean at MONEYWISEHQ
The Investment Thesis for Disney remains valid and the stock price pullback is an opportunity.
What is interesting about Disney is that it is perhaps the most economically sensitive stock and yet given the concerns of an economic slowdown, the stock price has not been affected to the same degree as others.
US economic data has been strong with record employment and wage increases, low inflation and low oil prices. If the stock market truly believed rising interests rates were a threat to the US economy and an imminent reduction to employment wages or the economy existed a consumer discretionary such as Disney would be sold off.
The Disney anomaly is one reason why the current market selloff is suspicious.
Disney offers an opportunity to accumulate shares or initiate a new portfolio position. Downside risk is defined at $110 with upside reward to $117 and possibly higher if the stock price breaks outside of the trading range.
Maintain a disciplined ‘Stop Loss’ near $108.

