FACEBOOK (FB) ANALYSIS
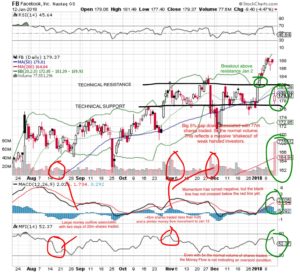
Facebook had been trading within a range established by technical support at $177 and technical resistance of $182 (-2.5% range) for a period of 8 weeks.
 January 2, the stock broke out of this trading range on slightly higher than normal volume and increased by ~5%.
January 12, the stock price gapped down by 5% on 5 x the normal daily trading volume (77m). This kind of breakdown on massive volume reflects a shakeout of investors who sold on panic, had purchased shares leveraged on margin, or were leveraged on call options and had to cover losses.
The January 12 price bar stops exactly at $177 and only goes as high as $181. The stock fell right back into the range where buyers were waiting at technical support and sellers who wanted to get out, sold at technical resistance. This price bar reflects the concept of support/resistance in chart reading.
MACD – the momentum turned negative, however the black line has not crossed below the red line and this should be closely watched. A black under red cross would indicate a sell signal.
Money Flow – 77m shares, or 5x the daily average were traded. What is interesting is that the money flow did not drop to an ‘oversold’ level. This indicates that buyers were waiting to put money into the stock. By comparison look at Aug 16/17 which saw a big 2 day drop in money flow but the volume was only ~20m shares per day. also Nov 1 had a similar money flow reduction to Jan 12, however the volume was ~45m shares and the stock price increased the next day.
Why?
Whenever a stock makes a big move we have to ask ourselves why?
The trading range was likely established as a result of news overhang associated with false postings and advertising during the US election and possible regulation affecting Facebook and advertising revenue losses. In late December news was released that Facebook was looking to replace newsfeed priority with friends posts. With the rumours, the stock price rose over the following days.
January 12, Facebook CEO Zuckerburg publicly announced the initiative of the company. Facebook generates revenue through advertising, so any advertising reduction directly affects profitability and Earnings Per Share (EPS).
Catalysts
FB reports earning Feb. This earnings report will reflect advertising revenues ending December 31 and the seasonally strong Holiday period which is when the highest levels of advertising occur with strong yields.
What does that mean at MoneyWiseHQ
Over reactions to news events often provide profitable trading opportunities if there is no material change to the business. More simply, if a good stock goes on sale, it can be an opportunity to buy.
With FB stock price near a long term established technical support level, a massive shakeout of weak handed sellers, a strong advertising season and a reflection that the price recently increased on the same rumour as the actual announcement, FB appears to be a low risk buy opportunity.
HOWEVER, risk management is extremely important and with such a significant breakdown, massive selling and the MACD black line not yet crossing under the red line and money flow not reflecting an oversold condition there is risk of further selling pressure. To manage that risk a disciplined stop loss sell price not more than 3% below the closing price of $179 should be respected. It is better to take a small loss and wait for the next stronger trade setup, than persevere with a trade that breaks down further into the $166-$172 trading range..
The following video also provides a similar analysis and should be considered.
