- JP Morgan is a best in class institutional bank with a strong domestic focus and international exposure.
- In the Q4 2018 Conference Call management outlined a plan to expand it’s deposit base by moving into previously unserved markets. The past week, JPM announced they would be opening branches in twelve new cities.
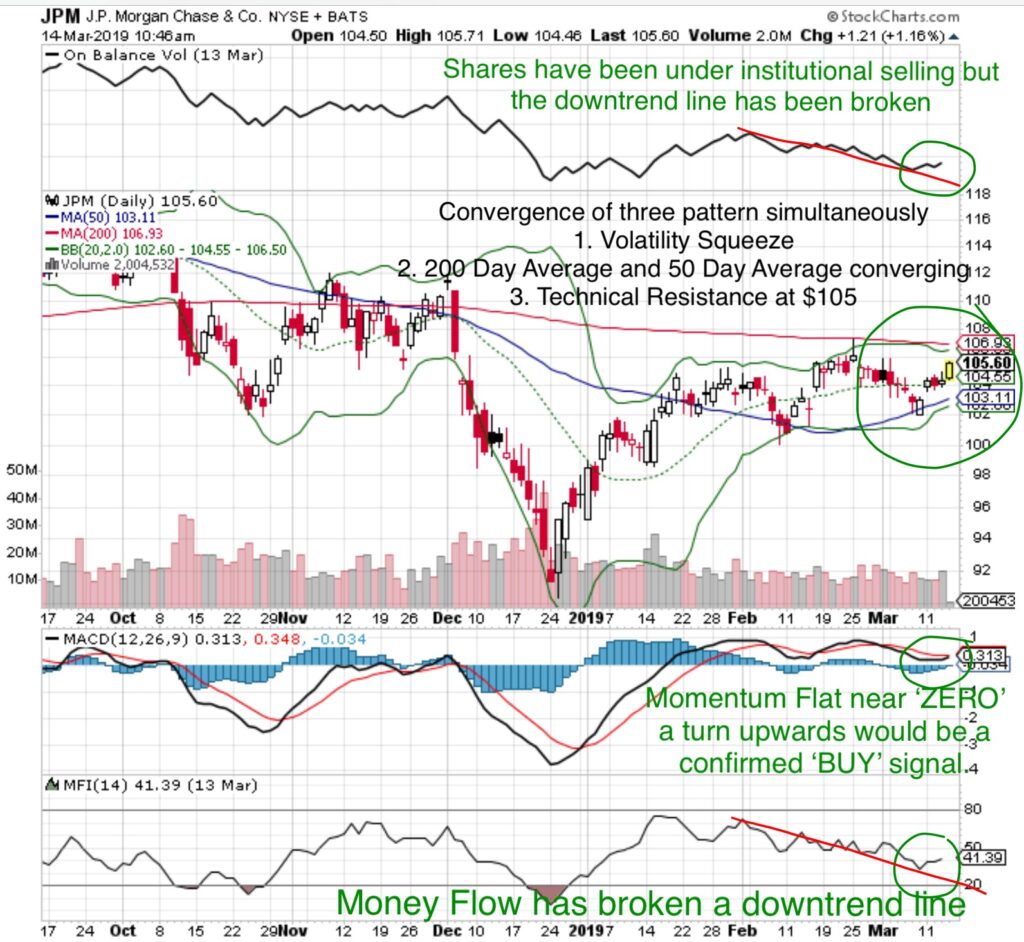
- Five technical patterns are converging simultaneously which could propel the stock upwards of ten percent in the short term.

Money Flow Index (80 is Overbought, 20 is Oversold): 41 – has been in a downtrend while the stock price has been in a shallow uptrend. The downtrend has been broken with a bounce off a near Oversold level of 35.
MACD Momentum: has been flat for nearly six weeks trending near the ‘ZERO’ line. A turn upwards would be a confirmed BUY signal.
On Balance Volume (OBV indicates share accumulation/distribution): Shares have been under selling pressure in a downtrend line. The downtrend line has been broken and shares are under accumulation.
Three patterns are converging simultaneously
- Volatility Squeeze – Upper and Lower (Green) Bands are compressing within a 3% range
- 200 Day Average and 50 Day Average are converging reflecting the stock price over the past 50 days is near the same price it was approximately 10 months ago.
- Technical Resistance at $105
There are two additional patterns which have been establishing since January
4. Series of ‘higher lows’ in which the stock price pulls back in the first week of Jan, Feb and March but each time buyers come in at a higher price ($99, $100, $102). This also reflects a lower willingness of sellers to sell.
5. Flat Base Pattern: develops when a stock price trades within a tight range for at least five weeks, although the base may last longer. The price range from the high point to the low point is generally 10-15%. This reflects an underlying strength. When the price approaches the low end, Big Money Managers step in to shore up the stock and further downside is limited as general investors find value in the price.
A Flat Base Pattern generally resolves itself to the upside in an explosive move following either a catalyst or broader market rally. However, catalysts can also be negative, causing a downwards resolution.
A breakout from a Flat Base should occur with an increase of Trading Volume by about 30% to confirm institutional buying.
What does that mean at MONEYWISEHQ
This stock just needs a catalyst and that catalyst might be a simple as ‘Rotation’.
A market recovery occurs in three waves. The strongest stocks recover first. When these reach a fully valued level, profits are taken and the leaders are used as a source of funds rotating into strong companies which have lagged the market but offer the greatest potential upside. When these stocks reach a fully valued level, funds are rotated into the weakest of stocks.
First movers were industrials such as Boeing and some areas of tech such as cloud, FinTech and chips stocks. Recently moved has rotated into big cap tech stocks including Apple, Amazon and FB. The financial stocks have been laggards. For the market to continue to rise, financials will have to participate. It’s important to choose the best quality stocks with the strongest Investment Thesis.
In a volatile market, minimizing risk is important, which means looking for stocks which fit a formula
- Technical Indicators – Money Flow Index in an uptrend from a low level, On Balance Volume showing share accumulation, MACD Momentum providing uptrend potential
- An established or predictable trading pattern such as a Trading Channel or Volatility Squeeze.
- Strong Investment Thesis, but the stock has not participated in the broader market recover.
JP Morgan meets all these criteria, however a disciplined strategy must be followed.
TARGET 1: $110
TARGET 2: $118
TECHNICAL SUPPORT (downside risk): $100
STRATEGY
- Accumulate shares near a low risk entry point of $102. Maintain a disciplined ‘STOP LOSS’ sell price near $99.
- Use the Flat Base strategy, Initiate a position or accumulate shares on a breakout above Technical Resistance $105. Maintain a stop loss near $103 in the event the trade does not materialize. Maintain a trailing percent ‘STOP LOSS’ 1% to 2% in the event of a broader market pullback.
A good investor has to be aggressive to make money, but if you are not defensive you won’t keep your money. Maintain a disciplined investment strategy.
