March Headlines
- US Federal Reserve raises rates 0.25% forecasts six hikes in 2022
- S&P500 has best three weeks since 2020
- Warren Buffet buys Chevron and Occidentasl Petroleum
April Headlines
- Dow tumbles 900 points and the Nasdaq drops 4% on Friday to close out a brutal month
- Warren Buffet reveals major stake in HP
- Inflation hit 8.9% in March
- No Peace in Ukraine/Russia Conflict, enters 3rd month
- China Lockdown due to Covid
- Inflation 8.3% in April
June Headlines
- Jamie Dimon (CEO JPMorgan) says ‘brace yourself’ for an economic hurricane caused by the Fed and Ukraine
- Inflation Rose 8.6% in May highest since 1981
- Ukraine/Russia War enters 100th day
- Bitcoin drops 17%, falling below $23,000 as $200 billion wiped off crypto market over the weekend
MARKET DYNAMICS
In the 14-03-2022 Market Update we discussed Investor Psychology and the stock market supply/demand balance being described by 5 concepts
- Expectations
- Price Discounts Everything
- Prices are not Random
- History Rhymes, it does not repeat
- Behaviour Patterns are Independent of Time
There are 5 primary ‘Market Players’
- Big Money Managers
- Computer Algorithme Hedge Funds
- Short Sellers
- Day Traders
- Retail Investors
Market Players take all of the information available, process it and formulate their strategies on how to make money regardless of whether the market is in an uptrend or a downtrend.
The ‘Uptrend’ or ‘Downtrend’ reflects “Investor Sentiment”, and “Investor Sentiment” is what determines a stocks price, which is separate from the true value of a company.
What is the value of a company? From an investor standpoint, there are two core ways to value a company.
- Book Value – This is the ‘accounting’ value of a company, it is the assets minus liabilities. Assets are ‘tangible’ items such as cash, the buildings, equipment, inventory, and ‘intangible’ items such as patents or intellectual property and ‘Good Will’ (Good Will is an intangible asset best described as the brand recognition or reputation of a business). Liabilities are the accounts payable, debts such as loans and corporate bonds. Book Value is the value of the company on its ‘Balance Sheet’ which is provided in the quarterly financial reports.
- Market Capitalization – This is the value that investors put on the company. It is calculated by multiplying the share price times the total number of shares outstanding. For example Apple share price $155 with a total number of shares outstanding 16.32B, the Market Capitalization value is $155 x 16.32B = $2.38T.
The value that investors put on the company (Market Capitalization) minus the accounting value of the company (Book Value) is the ‘Premium’ that investors are willing to pay to own the company.
If “Investor Sentiment” is high or rising because there is a strong macroeconomic environment, low interest rates, declining input costs and there is an expectation of increasing Book Value or profitability, investors will pay a higher ‘premium’. This stimulates ‘Demand’ for stocks (buying).
If investor sentiment is low or declining because there is a weakening macroeconomic environment, rising interest rates, increasing input costs and there is an expectation of decreasing Book value or profitability, investors will be willing to pay a lower ‘premium’. This stimulates Supply of stock (selling).
The stock market is a ‘marketplace’ where ‘The Crowd’, or ‘market players’, meet to buy and sell shares.
‘The Crowd’ determines ‘Investor Sentiment’ and it is sentiment which explains whether the ‘market price’ is above or below the estimated fair or ‘book’ value of the company.
From March 2020 to November 2021, ‘Investor Sentiment’ was high and the stock market was rising. As the market rises, the size of ‘the Crowd’ builds. As ‘the Crowd’ builds, it becomes more confident and bullish and they commit more and more money to their portfolios.
This was the phenomenon of 2020/21. An unprecedented number of new retail investors flooded the market with free or low interest rate government money which created a strong uptrend to the point of an extreme, or as many headlines labelled it, ‘Irrational Exuberance’.
Extremes in sentiment often mark the end of a trend.
In a downtrending, or bear, market Investor Sentiment takes the opposite role. ‘The Crowd’ losses confidence, investors withdraw from the market and more and more money flows out of portfolios. Until an Extreme of ‘Panic’ and ‘Discouragement’ is reached. When the selling is done, the market will rally and the cycle repeats (or rhymes).
The greatest profits are made by entering the market at the end/beginning of a trend, or at the ‘extremes’, which often means taking a position which is opposite to ‘the Crowd’ at those extremes.
However, while the trend is working its way to the extremes in ‘Exuberance’ or ‘Panic’, it is important to be on the same side of the market as the crowd.
The hard part is determining where that ‘Trend’ turning point is. We try to do this by monitoring three components
- News and its effect on corporate earnings
- Stock market Sentiment indicators
- Technical Analysis
STOCK MARKET SENTIMENT
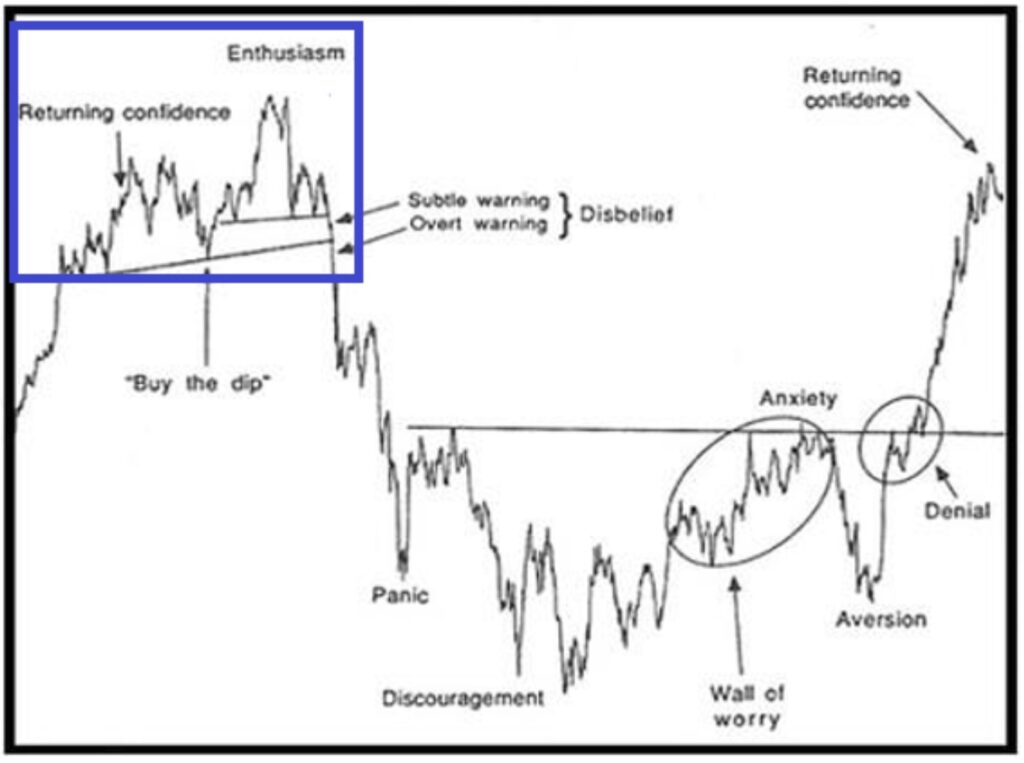
Where do you think you sit in the Market Sentiment Model? How about the sentiment of the stock market ‘Crowd’?
Hint – the Blue Box would have been November.
Are we at
- Disbelief – seeing subtle warnings but in disbelief that nothing much more can go wrong and the market will be alright.
- Panic – just selling everything because the market is collapsing
- Discouragement – market has gone down and it’s never going back up again
- Wall of Worry – better start buying stuff back because the market is going back up and you don’t want to miss out.
- Anxiety – market has gone up, but I’ve got my money back and it’s going to crash again so I better start selling stuff.
- Aversion – Don’t want to get involved in the market because it has been going down and will just keep going down.
- Returning Confidence – Market has been going up, so it’s going to keep going up.
The following is a chart from the American Association of Individual Investors (AAII). The results are taken from a survey conducted each week since July 1987.
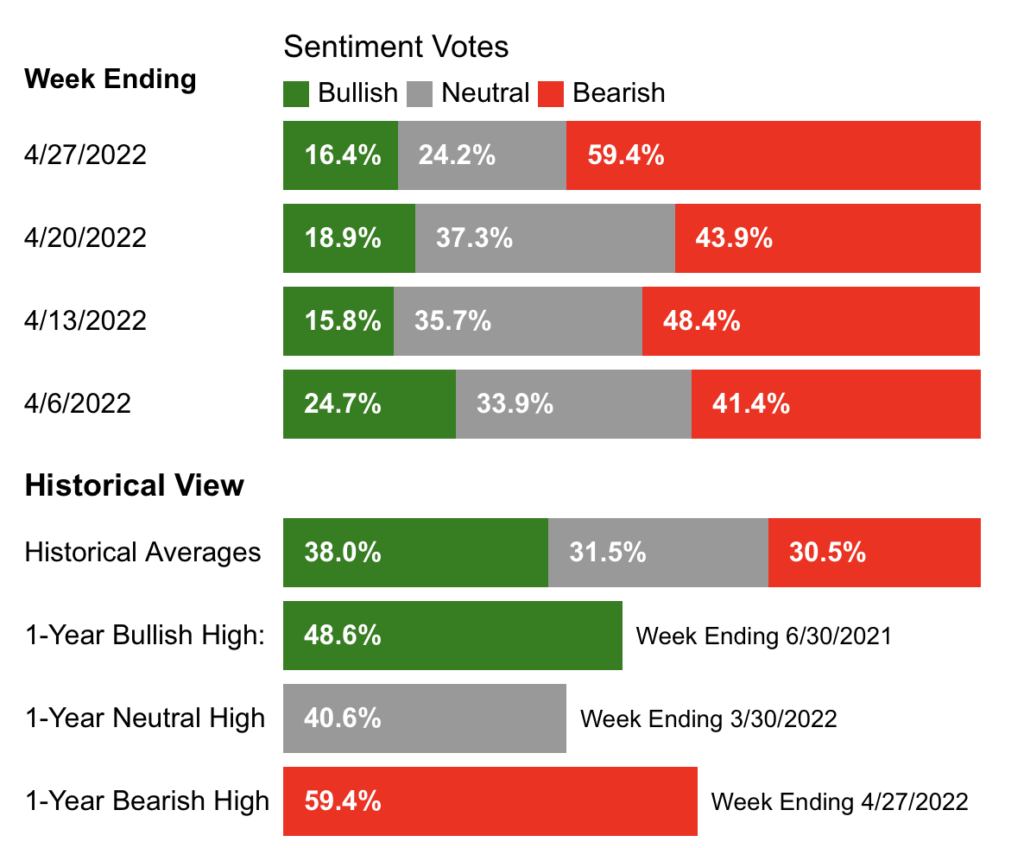
Sticking with the concept that market ‘turning points’ often happen at extremes, the AAII is generally considered to be at an extreme when either bulls or bears reach 70%, and many analysts consider that an actionable buy/sell signal. The biggest long term returns happen when the AAII ‘Neutral’ Vote is at an extreme, reflecting investors are undecided, and once the crowd chooses a direction the average 26 week return for the S&P500 is 8.6% and the 52 week return is 17.7%.
On April 27 the bears were at 59.4% which is the lowest since the Covid low in March 2020. The Bulls were at 16.4%.
Both the Bulls and Bears were approaching extreme levels, which reflects one of three scenarios
- the bears know something big is coming
- the bears are wrong and the market is close to a turning point
- The market needs one last negative push to drive sentiment to ‘Panic’ which would get the AAII bears from 59.4% to an extreme below 70% which would confirm a turning point.
7 Weeks Later
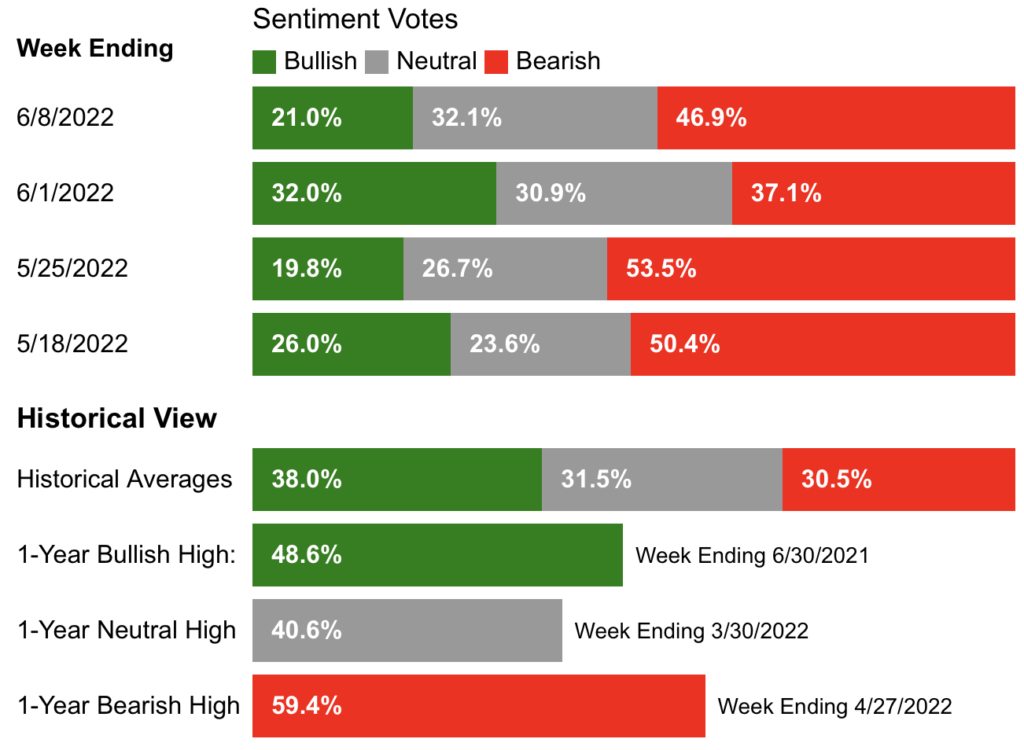
Not much has changed but notice that the ‘Bearish has declined and the ‘Neutral’ has had the biggest gain. Also note the ‘1 year Bearish High was from chart 1 on April 27, 2022.
Changes in ‘Sentiment’ take time.
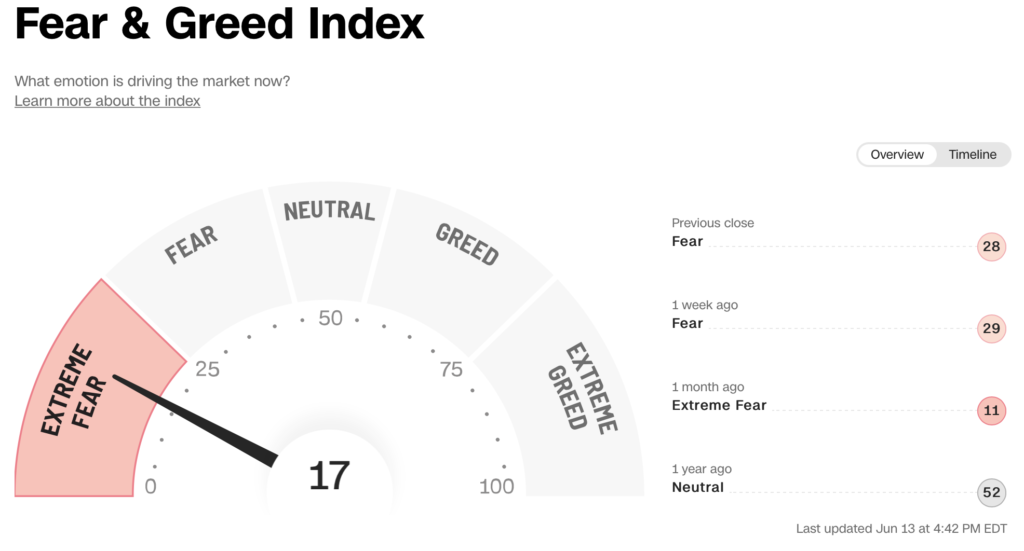
Fear and Greed Index
HEADLINES
“Be fearful when others are greedy and greedy when others are fearful” – Warren Buffet
We will address geopolitical headlines separately, however there are five headlines that stand out.
- Warren Buffet buys major stake in Chevron
- Warren Buffet buys major stake in Occidental Petroleum
- Warren Buffet buys major stake in HP
- Warren Buffet buys major stake in Activision.
- Berkshire buys citigroup, Paramount and other stocks.
Berkshire Hathaway has total Assets Under Management of $331 Billion and can be considered a proxy for the contrarian Big Money Managers. The purchases reflect that he sees value in oil and that certain parts of tech and financials are undervalued.
The questions have to be asked
- Is Buffet mistiming the stock market?
- Why is Buffet buying if the near to long term would present opportunities at lower prices in the event of a recession.
UKRAINE/RUSSIA IMPACT ON EARNINGS
At stockmarketHQ we try to invest in companies which are valued on the companies performance, or fundamentals, and avoid companies who’s value is determined by external threats such as geopolitics. It’s a strategy which provides stable, consistent and predictable returns.
In mid-March JPMorgan put out the following chart to assess the impact of Russian exposure on companies.
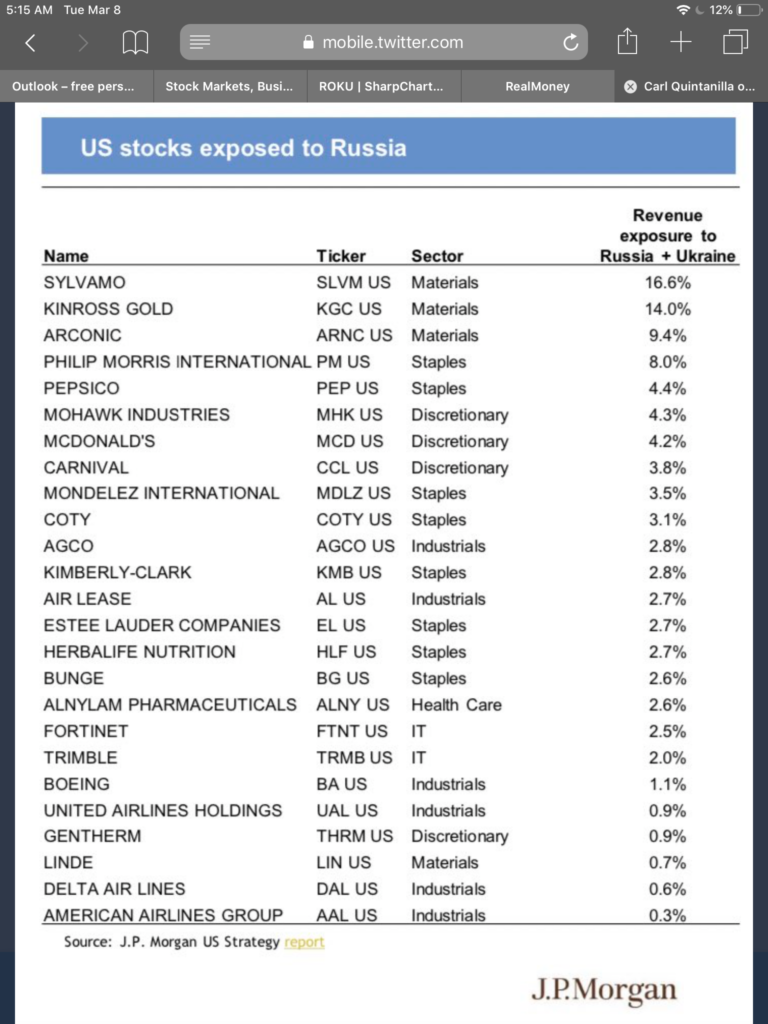
Most international conglomerates on the list only have 1-4% exposure. In the April 2022 Earnings reports, the impact on revenues were consistent with JPMorgans assessment.
The most notable portfolio stock is Boeing, which reported a charge write off of $212M as a result of its exposure to Russia. For a company which generated $13.99B in revenue, that’s comparatively a small 1.5% impact.
OIL PRICES
The greater concern to Big Money Managers is the effect on commodities prices and inflation, in particular oil.
Oil prices are a function of supply/demand.
Sanctions on Russia have reduced ‘Supply’, which in the equation would correctly drive prices higher.
However, consider that China, the worlds second largest oil consumer at 13.2%, is currently in Covid lockdown. That is a significant impact on demand.
Why is the price of oil high?
Current prices are largely influenced by futures contracts.
- IF China comes out of lockdown, demand will increase.
- IF the summer season for travel is busy, as travel companies have expressed in the forward guidance of earnings reports, demand will increase.
- IF the Ukraine/Russia conflict and sanctions is prolonged, supply will remain tight.
This is the base case for high oil prices and investing in oil stocks, by ‘the Crowd’, which is taking the view that these three issues will persist for the next 3-6 months.
However, there is an interesting phenomenon under the surface. IF oil prices were expected to remain high for the long term, drillers would begin drilling and oil companies would be making CAPEX (Capital Expenditure) investments in new projects. This would be reflected by rising prices in oil services stocks such as Schlumberger (ticker symbol SLB).
This reflects two scenarios
- Price of oil remains high on geopolitical events and declines once the events are over, or
- Oil services companies are the next to advance within the sector
INTEREST RATES AND INFLATION
It has been over one year since US Federal Reserve Chairman Jerome Powell made his speech which expressed that ‘inflation will be transitory and should resolve by the end of 2021’
- In March 2022, the US Inflation rate hit 8.9%.
- In April 2022, the US inflation rate hit 8.3%.
- In May 2022, the US inflation rate hit 8.6%
This misreading of the economy has brought into question, by investors, the Federal Reserve’s ability to accurately forecast the economy.
At the May 2022 US Federal Reserve Meeting, an interest rate increase of 0.5% was announced.
How does interest rates tie into the supply/demand equation?
The current economic environment of rising inflation is largely caused by ‘supply’ constraints due to
- China Covid lockdown
- sanctions on Russian commodities
The US Federal reserve cannot affect the ‘supply’ side of the equation.
Therefore the only way to slow inflation is to reduce demand. This is done by raising interest rates, which makes it more expensive for consumers to borrow.
RECESSION
Many media ‘Talking Heads’ and economic forecasters are publicly stating that there will be a recession within the next 18-24 months.
A recession is defined as: a period of temporary economic decline during which trade and industrial activity are reduced, generally identified by a fall in GDP in two successive quarters.
‘But this time is Different’ is the key concern of Big Money Managers.
All recent history recessions are a result of decreasing ‘Demand’ and the US Federal Reserve has had the ability to Reduce interest rates or Print money.
This economic environment is due to ‘Supply’. To reduce inflation the standard practice is to Raise interest rates. Effectively that would ‘force’ a recession. Raising rates while the economy is in recession is the opposite of economic strategy.
TECHNICAL ANALYSIS
What does all that mean at stockmarketHQ
We’ve closely examined the concept of ‘Market Sentiment’ and taken a look at five key areas affecting that sentiment
- UKRAINE/RUSSIA EFFECT ON EARNINGS
- HEADLINES
- OIL PRICES
- INTEREST RATES AND INFLATION
- RECESSION
We recently attended a two day Chartered Market Technician conference and there was an interesting observation. 10 out of 10 presenters were bearish on the market with one exception. The publisher of the “Stock Market Almanac” expressed that the next six months would be the worst period and then in the fall, the markets should rise again corresponding with the timing of the US mid-term elections. 10 out of 10 market technicians bearish on the market could be considered an ‘extreme’.
The AAII survey reflected a near extreme bearish sentiment on April 27.
Turns in the market often happen at ‘extremes’.
Because of the ‘Market Sentiment’ the ‘Premium’ that investors are willing to pay has collapsed.
‘Market Sentiment’ takes time to change. Reflecting on the ‘Market Sentiment Model’, the Panic/Discouragement/Wall of Worry bottoming process takes time with lots of false rallies.
In the investing world, those five key areas are called ‘Noise’. The potential of a recession 12-18 months from now does not affect people using Facebook (meta platforms) today. Ukraine/Russia doesn’t affect people buying iPhones. Oil prices don’t affect corporate digital transitions.
So what is the market decline really about, one word.
MONEY
We’ve previously discussed two important concepts
- ’Free Money’ becoming ‘Cheap Money’ becoming ‘Expensive Money’. The US Federal Reserve is effectively skipping the ‘Cheap Money’ phase and going straight from ‘free Money’ to ‘expensive money’. This has effectively forced Big Money Managers to take money out of the financial system until they find the balance between risk / the cost of borrowing to invest / reward.
- Money always rotates between macro-themes
- 2020 – Stay at Home Theme
- 2021 – Reopening Trade Theme
- 2022 – Sanction Theme
Sanctions – Oil and commodities are the new Covid.
From the Technical Analysis we can see clear evidence of ‘Short Selling’ strategies which are ideal when
- there is an information vacuum
- there is no underlying buying by Big Money Managers
Looking at individual stocks, prices have declined, but not as a result of ‘selling’, it is a result of ‘No Buying’. That can change at any time though. In order for the market to move lower, there are a lot of investors who bought in the last six months that will have to be selling at a loss.
Prices always have to move based on a catalyst.
June 15th the US Federal Reserve announces its interest rate and provides economic commentary. This catalyst will move the markets as Big Money Managers evaluate the impact on their portfolios.

