- Fear and Greed are the two hardest emotions to control when investing, but understanding them is the secret to making the best decisions for financial gains.
- Businesses and borders are closing, but the financial stimulus taps are being fully opened in a globally coordinated effort which will drive the business cycle with the passing of the Coronavirus and the lead up to a US Presidential election.
- Market indicators provide simultaneous confirmations of an extreme ‘Oversold’ condition.
HEADLINES
- Global Coronavirus cases exceed 156,000, total deaths exceed 5900
- US stops all international flights for 30 days. Cruise ships stopped through June.
- Disney closes Florida park, Apple and Nike close all stores outside China.
- US airlines cut capacity by 75%.
- US declares national state of emergency
- US begins financial stimulus initiatives and Coronavirus funding bill
EXTREME FEAR
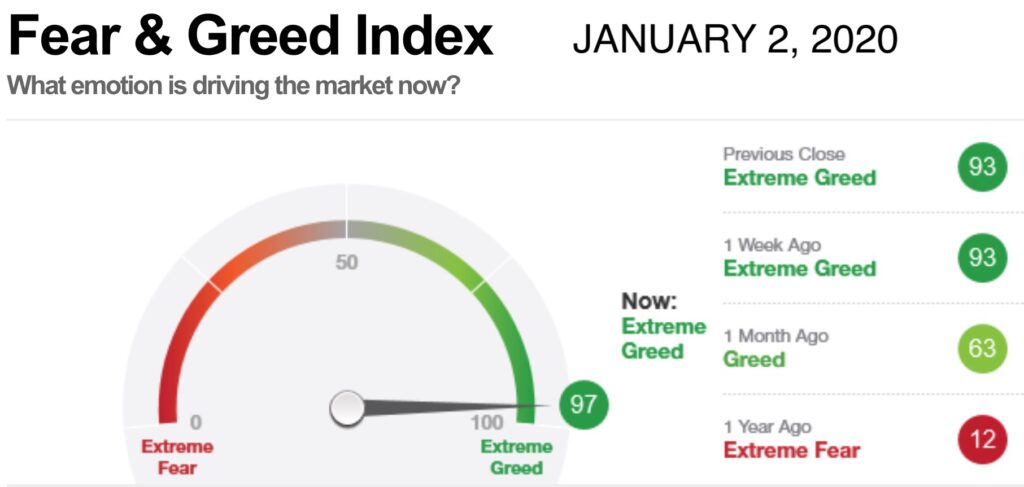
The time to sell is when the market is at extreme levels of ‘GREED’
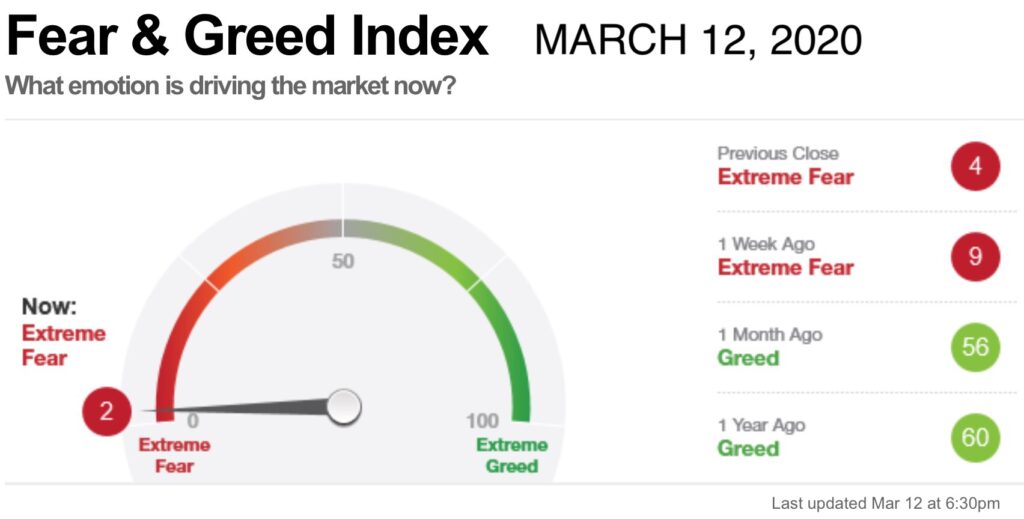
The time to BUY is when the market is at extreme levels of ‘FEAR’
THE SENTIMENT CHART
The market sentiment chart is commonly used as a reference for understanding the psychology of investors during market selloffs with a significant catalyst.
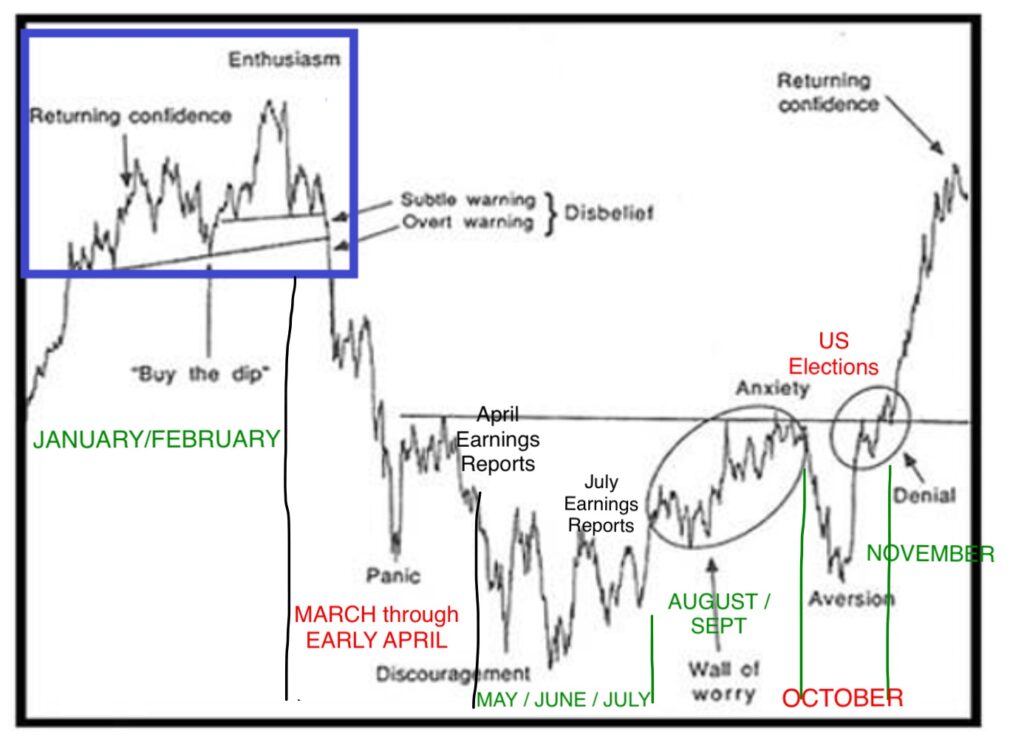
We can use this chart to establish a rough investment or trading plan going forward when combined with the various known catalysts.
January/February – Buy the Dip – the market rose to record highs which corresponded with the CNN Fear and greed index at Extreme Greed and the philosophy was ‘Buy the dip’.
Early February – Disbelief- Coronavirus begins to spread through China. Airlines stop flying to China and the country goes into self quarantine mode. The market pulls back but there is a sense of ‘disbelief’ that the virus can spread significantly outside China.
Mid March – Panic – Coronavirus cases increase in US, Italy and other EU countries close down, airlines stop international flights. Stock Market drops most since 2008 financial crisis.
Market recovers on financial stimulus plans. March options expiration occurs March 20. ‘Short Sellers’ will have to cover their short positions (buy) by this date if the market does not pullback. Short Covering (or forced buying) will have the effect of increasing share prices.
Mid April – Discouragement – market sells off either on ‘Earnings Warnings’ (the first quarter ends March 31, companies will be required to disclose if they did not meet previously disclosed guidance provided in January) or ‘uncertainty’ from the effects of Coronavirus in anticipation of actual earnings reports which begin around April 15.
May/June/July – the bottoming process – based on the China timeframe the virus time to peak could be considered eight weeks, which would time the US peak for mid to late April. Once the virus has run it’s course, the economic cycle will begin again, financial stimulus will begin to kick in. The worst of the economic reports will show the backwards looking data which may reveal the economy entered a recession or low growth.
With the ‘bad news priced in’ investors will begin to ‘look forwards’ with prices rising into the second quarter July Earnings reports.
August/September – Wall of Worry – Big Money Managers will be buying, but investors will be worried that the economic recovery is ‘fragile’. When combined with the US Presidential election, investors will be buying based on electoral promises of subsidies, tax cuts and health care benefits but there will be ‘anxiety’ as to what will happen if the wrong candidate wins.
October – Aversion – As the election approaches, investors will stop buying (possibly selling) based on the ‘uncertainty’ of what will happen if a candidate unfavourable to the stock market wins.
November – Denial then Returning Confidence – with the ‘certainty’ of the election over, investors will begin to buy as the effects of the stimulus benefits businesses and the growth cycle resumes with growth rates showing sizeable increases when compared to the previous years results.
There is no ‘crystal ball’ when it comes to investing as there are an infinite number of variables, but when considering the known catalysts going forward, it can be used as a rough template to plan investments/trades and manage the emotions of Fear and Greed in the coming months.
VOLATILITY INDEX (www.stockcharts.com ticker $vix)
The Volatility Index is often referred to as the ‘Fear Gauge’.
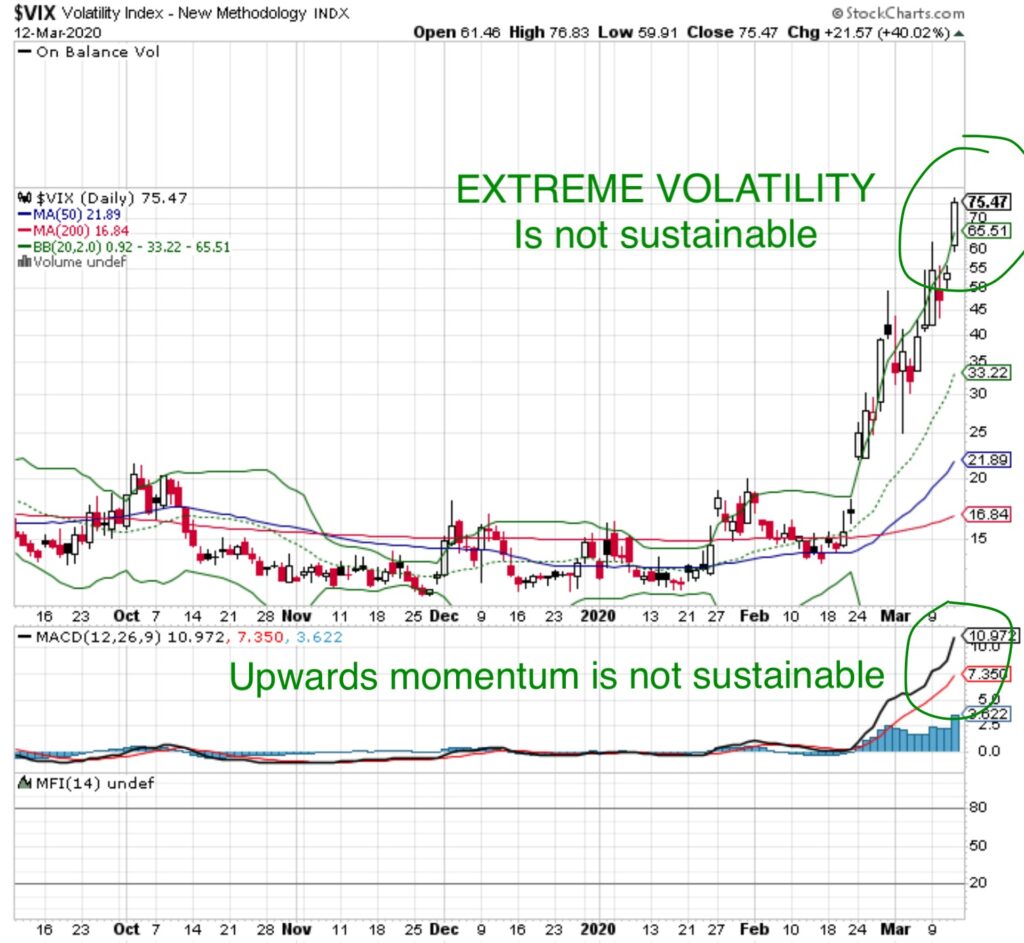
The level of ‘Fear’ is at an extreme level not seen since the financial crisis of 2008.
This level of ‘Fear’ is often reflective of margin calls forcing individual investors to sell, and hedge funds being forced to sell to stay liquid or meet investor redemptions or withdrawals. Extreme volatility is not sustainable.
MCCLELLAN OSCILLATOR (www.stockcharts.com ticker $NAMO)
Indicates market ‘Overbought’ or ‘Oversold’ conditions.
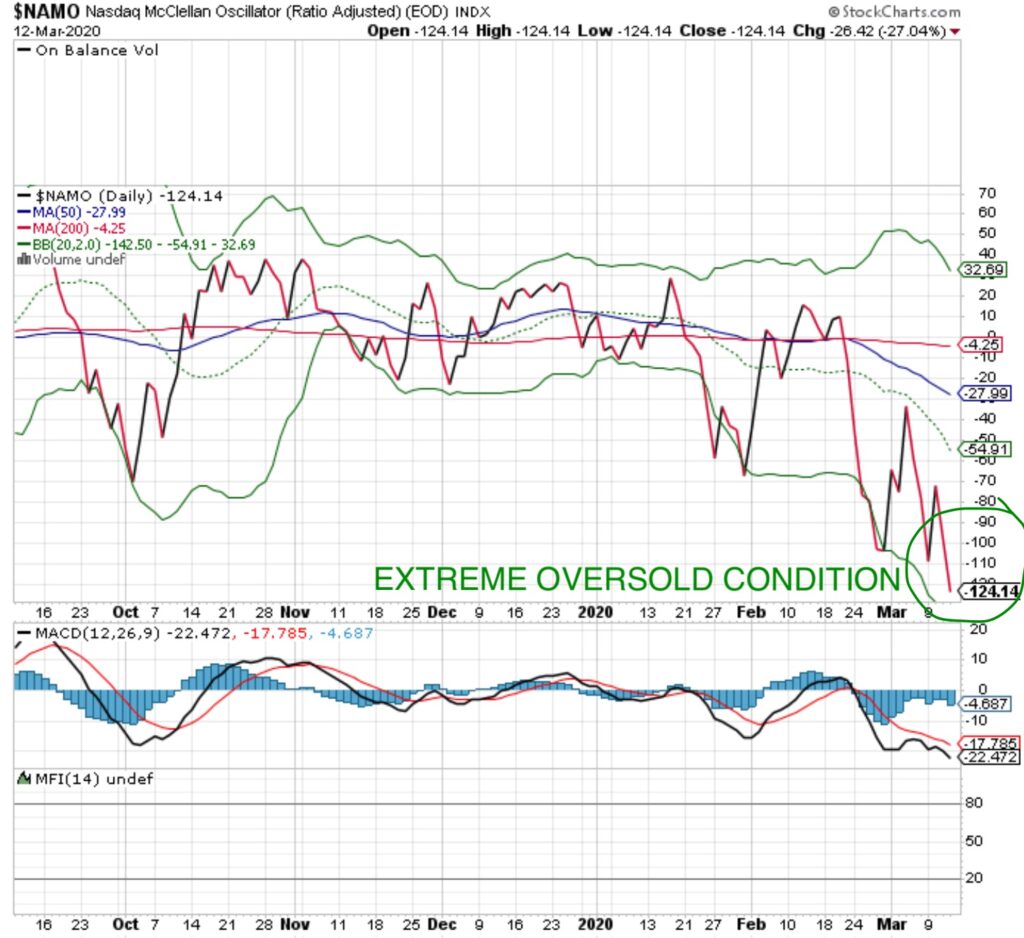
-124 is an Extreme ‘Oversold’ condition.
Extreme ‘Oversold’ conditions occur after all the Big Money Managers that have sold to protect assets from further declines, hedge funds are forced to sell to remain liquid or cover investor redemptions or withdrawals and when your buddy who knows nothing about stocks has decided to sell because the market has crashed.
At this point, anyone who could possibly want to sell, has sold.
That is when it is time to buy.
Money Flow Index – (80 indicates ‘Overbought’, 20 indicates ‘Oversold’)
S&P500
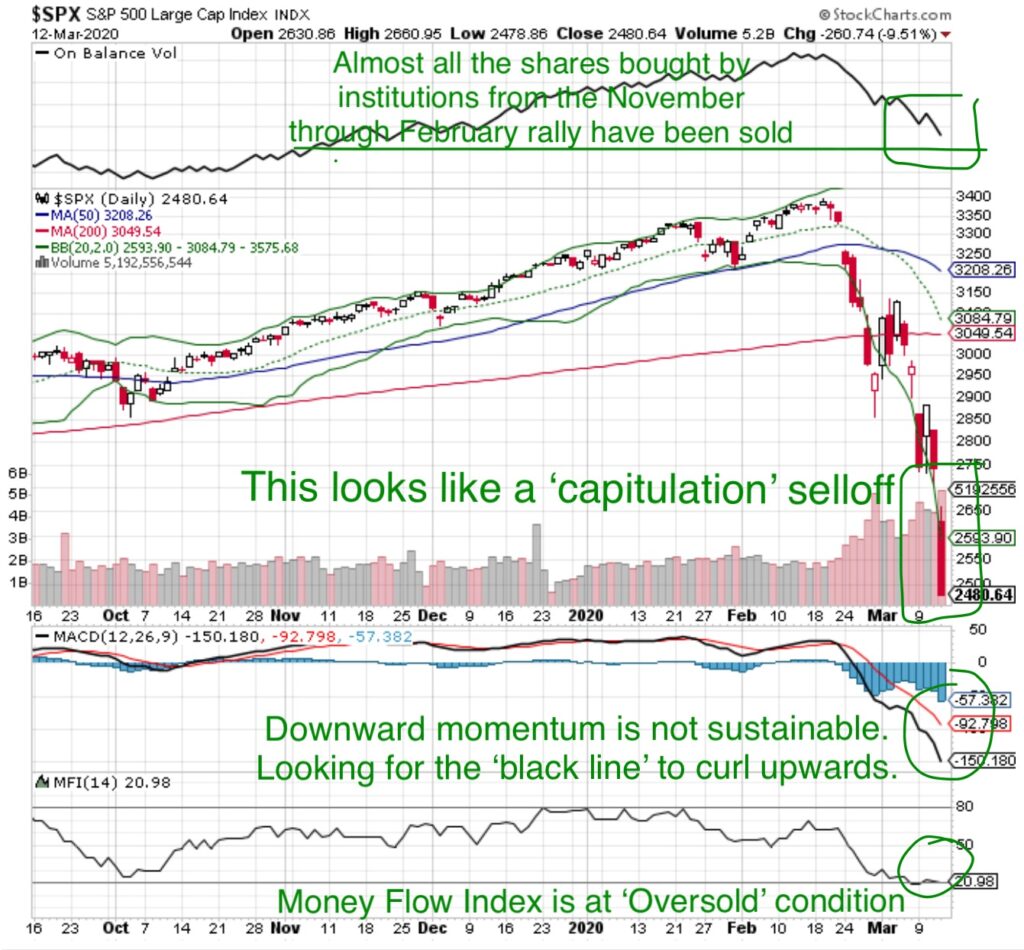
At 20.8 the S&P500 is at an ‘Oversold’ condition.
MACD Momentum – the extreme downward momentum is not sustainable. The ‘black line’ curling upwards will be the first indication of a change in market direction.
On Balance Volume – nearly all the shares bought by financial institutions since the rally began in November have been sold. This confirms the Money Flow Index ‘Oversold’ condition.
Capitulation Selloff – occurs when there is a large decline in value corresponding with a large share exchange volume. What is interesting is that the March 12 volume was only as high as the February 29 selloff volume. This reflects less ‘selling pressure’ even though there was a larger decline.
Recall that price is a function of supply and demand. The same ‘volume’ on February 29 and March 12 reflects the same supply, but the greater price decline on March 12 reflects there was less ‘demand’. That is to say the price decline was more of a result of investors not wanting to ‘buy’ vs wanting to sell. This is very positive and indicates the selling should stabilize.
What does that mean at moneywiseHQ
“Sell when others are greedy, Buy when others are fearful” – Warren Buffett
The biggest gains are made only three to four times a year at the extremes of fear and greed.
When making an investment we look for
- Best of Breed companies in their industry
- Companies which are operating within a Secular Trend
- Strong balance sheet and the ability to execute on the business strategy
Once we identify a company worth investing in, it is a matter of identifying an entry point with minimum risk and maximum reward and that often occurs at the point of extreme fear either in an individual stock or a broader market pullback.
All of the charts presented have simultaneous confirmations of an ‘Oversold condition’.
Based on the ‘Sentiment’ model it appears that we have hit the point of ‘panic’, in which case we can expect a market increase followed by a subsequent pullback. There is a chance the market could also be at the ‘discouragement’ phase and the market may continue an upwards grind but the ‘Sentiment’ model is a template which can be used as a rough guide.
It’s also important to remember, Trump wants a strong stock market with a strong economy and strong employment rate. This will be his campaign platform and if he wants a strong economy, he has the authority to make it happen, and the short sellers just can’t bet against the trillions of dollars that trump has in his economic arsenal.
If investing was an exact science or we had a crystal ball, it would be easy. We would know when to Buy and when to Short the market. But what we do have are the indicators and charts which tell us what the Big Money Managers are actually doing, which when combined with an understanding of how they think, helps us to identify opportunity.
The only guarantee we have is that money always flows, it never disappears and big money managers always have to have that money invested on behalf of clients to justify their fees.
Amid the current ‘uncertainty’, what we can be certain’ of is that in February we reached the point of Extreme Greed or Enthusiasm on the Sentiment chart, and at some point in the future we will return to ‘Returning Confidence’ with a stronger stock market. Maybe it’s six months, maybe a year. What happens between those two points is what we have to prepare for in order to capitalize on opportunities and manage risk.
