MARKET HEADLINES
- First Omicron Variant Cases Reported in the US
- Fed Chair Jerome Powell signals the end of Federal Stimulus Bond purchases
MARKET DYNAMICS
December is an important month within markets as there are a number of strategies that large financial institutions execute
Show your winners in the portfolio – Financial management is a marketing game to attract as much money as possible. At the end of the year, Big Money Managers want to show that they have the biggest winners on their books, so they cut their losers.
Tax Loss Selling – Institutions will have to pay taxes on profits at year end. Selling losers before the end of the year allows institutions to offset the losses against gains and reduce their tax payment.
Big Money Manager Bonuses – Wall Street runs on performance bonuses. The more profit, the bigger the bonus and the better the promotion to larger funds.
OMICRON AND THE END OF FREE MONEY
The moneywiseHQ investment strategy is founded on three pillars which provide the foundation of stock selection
- Best in Class – choosing the Best in Class company which is dominant in it’s industry, has a strong financial balance sheet and a shareholder return philosophy through either dividends or a share repurchase program provides the portfolio stability that large financial institutions depend on. These companies are the last to fall and the first to recover in a market correction.
- Secular Growth Trend – is a change in the trend of societal behaviour. Companies which lead the trend will experience rapid growth and companies which don’t adapt will be left behind.
- Strong Macroeconomic Environment – This is an important one to understand within the context of Omicron, the End of Free Money and how it affects the market and the portfolio stocks.
End of Free Money
The US Federal Reserve has a Bond buying program in which it purchases $120B worth of bonds each month which when combined with a Federal Interest Rate of 0.25% effectively provides massive amounts of ‘free money’.
Large institutions and Hedge Funds can borrow ‘free money’ and invest it in the stock market at a significant profit.
Start up companies and companies with low capital can borrow ‘free money’ to fund expansion or technology development which otherwise wouldn’t receive funding. A few examples of this over the past year would be the advent of multiple Electric Vehicle companies , alternative energy, speculative technology companies.
The upside to the End of Free Money is that it signals a strong macroeconomic environment. The downside of ‘free money’ is that when it stops flowing or the ‘cost’ of borrowing (rising interest rates) exceeds the financial return, that money will be pulled out of the stock market and speculative companies.
While the end of free money hasn’t begun yet, this is a ‘threat’ that needs to be monitored as it may change the market dynamic in the coming months. In the interim, it will provide a level of ‘uncertainty’ for financial institutions.
Omicron
A large part of the market rise can be attributed to the ‘Re-opening’ Investment Thesis fueling companies such as Disney, airlines and credit payment companies which benefit as Covid cases decline and people return to their past secular growth trends and move away from the ‘lockdown’ trends.
A company’s stock price is largely determined by estimates of future revenue and profit. Covid variants, such as Omicron, will bring a level of ‘uncertainty’ which can’t be calculated by financial analysts.
TECHNICAL ANALYSIS
VOLATILITY INDEX (www.stockcharts.com ticker $vix)

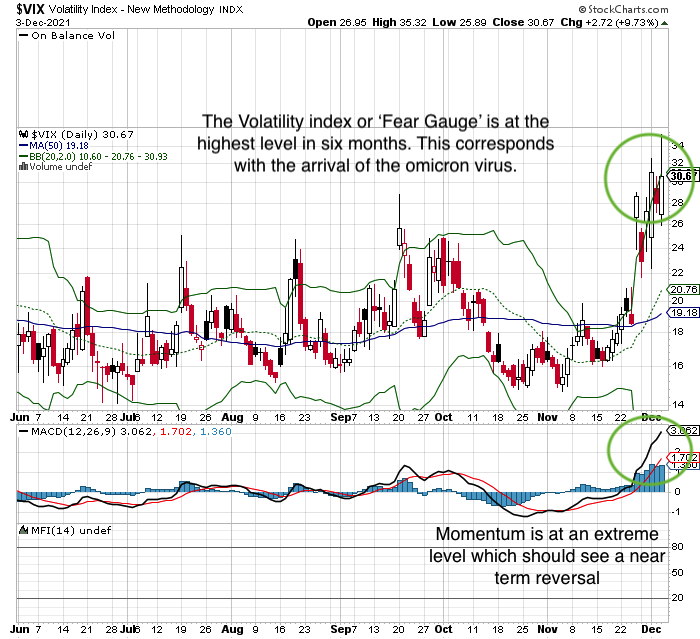
The ‘Volatility Index’ is often referred to as the ‘fear gauge’.
Volatility has spiked to the highest level in six months which corresponds with the Omicron variant and Jerome Powells announcement of the Bond Purchase tapering.
Momentum is at an extreme level. It can go higher (Omicron becomes a significant threat), but generally extremes signal a short term reversal is near.

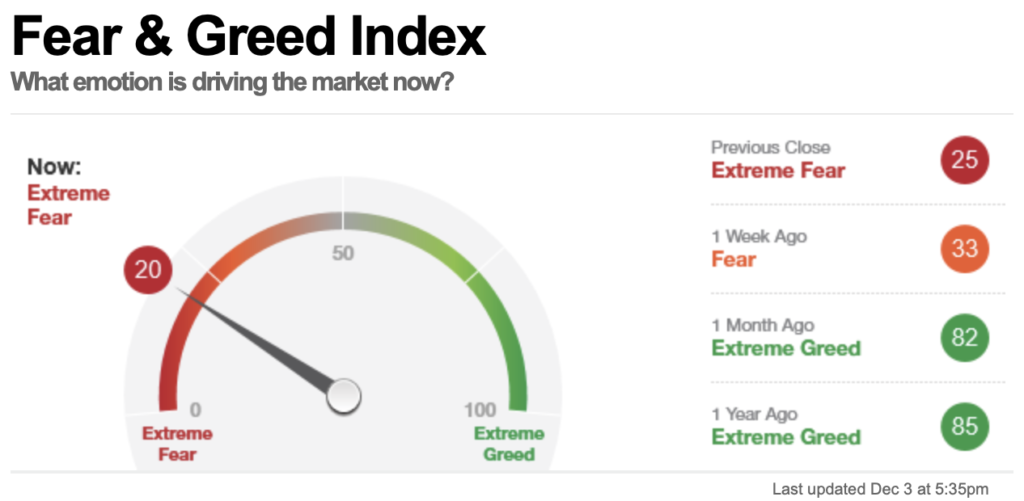
The CNN Fear and Greed Index also supports the stock market Volatility Index. Fear is currently at one of the lowest levels in the past 12 months. For reference, March 2020 saw this index decline to a reading of 1.
MCCLELLAN OSCILLATOR (www.stockcharts.com ticker $NAMO)

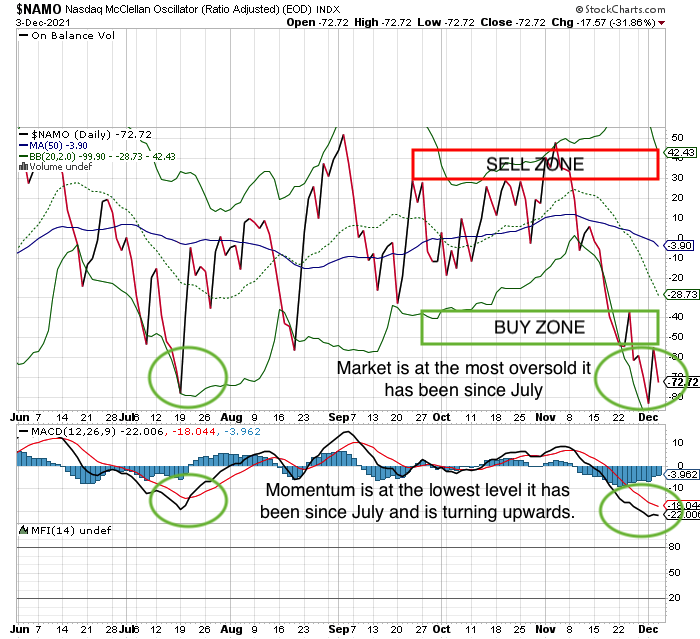
The McClellan Oscillator reflects ‘Overbought’ and ‘Oversold’ conditions.
The broader market is near an extreme ‘Oversold’ condition.
This generally signals a near term bottom.
S&P500

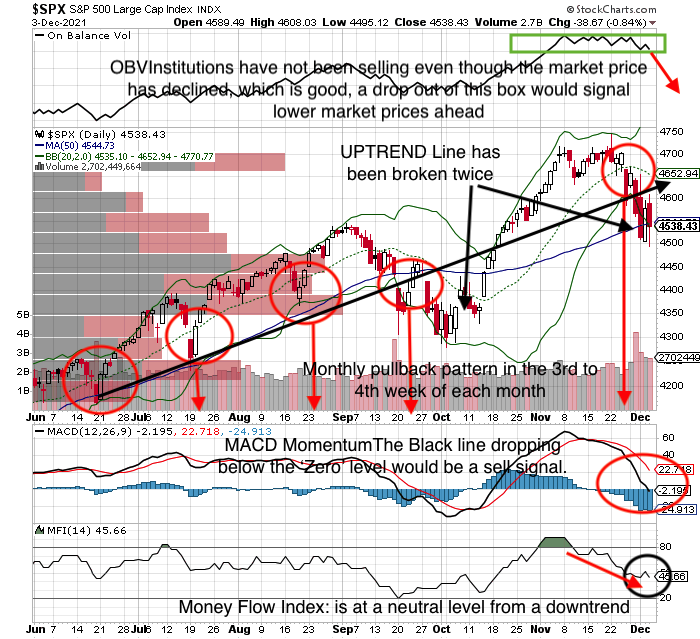
On Balance Volume (OBV)(indicates whether Financial Institutions are accumulating or selling shares) : This is very interesting. Institutions have not been selling shares, yet the market has declined. Reflecting that the decline is not from ‘supply’ but from a drop in ‘Demand’. If institutions begin to sell, it will signal further market declines.
MACD Momentum: When the ‘Black Line’ drops below the ‘Zero’ level, that is a sell signal confirmation. It is currently right at ‘Zero’ and in a downtrend.
Money Flow Index (80 is ‘Overbought’, 20 is ‘Oversold’): at 45, the indicator is neutral but within a downtrend. Money has been flowing out of the market, but not to an extreme degree.
Based on those three indicators, the market is at an inflection point. It either bounces and recovers or declines until all the indicators line up in an ‘Oversold’ condition.
Monthly Pattern
The current pullback does fall within the long term monthly pattern of a pullback in the final week of the month, or the first week of the subsequent month.
It is important to note that the October and December pullbacks have broken the six month long uptrend line twice which reflects that Big Money Managers are becoming more cautious and short sellers are becoming more aggressive.
What does all that mean at moneywiseHQ
There were a number of patterns which were almost predetermined to happen
- Marketing – showing winners on the portfolio, removing losers
- Tax Loss Selling
- Big Money Managers Bonuses
- Monthly Pullback pattern
But there always has to be a catalyst and there were two which corresponded simultaneously with the market patterns.
- US Federal Reserve Bond Purchase tapering
- Omicron
At moneywiseHQ we progress catalysts through three levels
Uncertainty – This is generally the absence of information. Big Money managers either sell, or they stop buying.
Threat – There is the potential that the catalyst may materialize
Event – The catalyst actually occurs and there is a defined market reaction and trend.
When the market pulls back due to ‘uncertainty’, this is referred to as an ‘Uncertainty Discount’.
The market is a function of supply and demand. The S&P500 chart doesn’t reflect that Financial Institutions have been selling significantly, reflecting that the current pullback is due to a lack of demand or ‘buying’.
If Omicron progresses from an ‘Uncertainty’ to a ‘Threat’ to the strong macroeconomic environment, Big Money Managers won’t invest and will use any market strength to sell, increasing ‘Supply’.
If Omicron doesn’t progress, then the current pullback presents an attractive ‘Uncertainty Discount’.
moneywiseHQ RULE #1 – “A good investor has to be aggressive to make money, but if you don’t have a good defensive strategy, you won’t keep your money.”

