- Financials have been the laggards of the broader stock market recovery on concerns of the economic impact of Covid-19 and US Government Bank Stress Tests.
- Earnings season starts with the banks reporting July 14-17. Stocks follow one of three patterns which sets up for the post reporting stock price reaction.
- Technical Analysis reflects a convergence of a number of indicators which may lead to higher stock prices in the financial sector.
MARKET LAGGARDS
There is a very interesting dislocation in the stock market which can’t be explained by any economic model.
The US Government has provided over $12 Trillion in financial stimulus., All money eventually flows through financial institutions either through distributions or collections. As funds flow, banks collect fees, they have access to capital for lending to collect interest charges and they act as the intermediaries between corporations conducting business.
Yet the financials stock prices have been stagnant, similar to corporations that actually sell goods such as Starbucks or Disney, while technology companies have skyrocketed. More traditionally, a recessionary environment would see high-risk stocks wiped out. Funds would flow through banks to corporations who would then make capital investments in infrastructure and equipment to support the manufacturing of the goods which they sell. This would create employment providing disposable income for consumers. Advertising would create consumer demand and the mediums for ‘sales’, such as brick and mortar stores or online sales platforms, would benefit. Stock prices would generally recover in that order.
The dislocation has occurred in that the stock market has bypassed banks, manufacturing and equipment and moved directly to the companies which provide ‘the new’ infrastructure. The ‘new’ infrastructure is the technology that powers advertising and platforms that generate sales.
It also has to be appreciated that the ‘new’ infrastructure doesn’t eliminate the old economic model. ‘Sales’ are still the end result. Goods that are sold, must still be manufactured, which requires equipment and capital expenditures.
But whether it is sales or capital expenditures, they all involve money, and money always has to flow through banks.
FINANCIALS CONCERNS
The question has to be asked, if all money has to flow through banks, why have financials been the laggards? There are two important concerns which are overhanging the sector.
US Government Stress Tests – At the end of June, the US Government conducted its Financial Stress Tests on banks which are a measure left over from the 2009 financial crisis to ensure banks have ample cash resources and won’t collapse. For 2020, this involved a worst case scenario involving the impact of Covid-19. The Government made two important determinations
- All banks must suspend share buyback programs – this is important because banks have been the largest buyers of their own shares which acts to create demand and increase share prices. For
example JPMorgan had a $20Billion share buyback program prior to Covid-19. - Increased Bank Stress Testing from once per year to a quarterly (4 times per year) testing system – Banks take
money and use it to make more money. Increased testing is currently viewed as increased government regulation which limits the amount of money that a bank can use to make more money with.
Loan Losses – Increased unemployment generally results in increased defaults on loans. This potential has to be balanced against a record low interest rate environment. Banks extend credit to consumers who purchase goods. The corporations that sell the goods get to keep the money, but if the consumer defaults on the loan then the banks are the losers.
EARNINGS SEASON
During Earnings Season stock prices follow one of three patterns
- Stocks run up in anticipation of strong results, then selloff when earnings don’t meet high expectations.
- Stocks remain neutral until the release then either move up or down based on the actual results
- Stocks decline as a selloff due to uncertainty of the results, then climb when results are not as bad as expected.
When we consider the ‘Market Laggards’ and ‘Financial Concerns’ discussion above and combine them with the Technical Analysis below, it appears that the financial sector is set up for pattern 3 in which prices have declined or established a training range and will rise when results are not as abad as feared.
TECHNICAL ANALYSIS
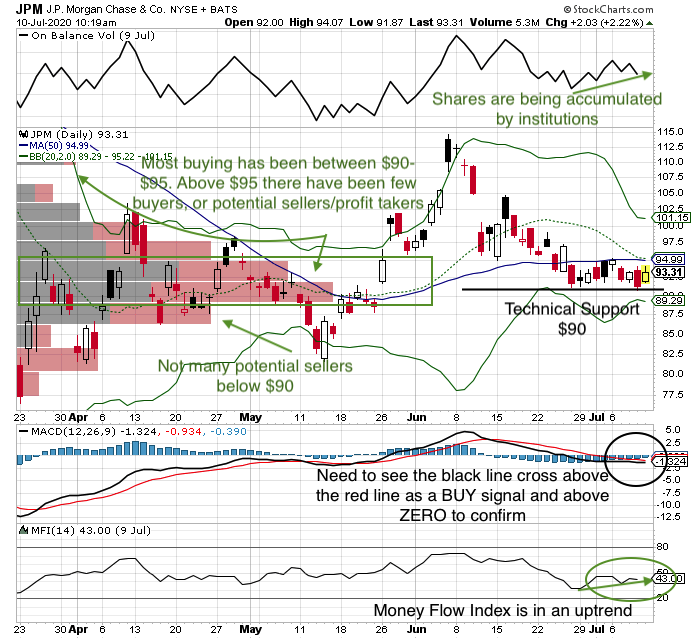
JPMorgan (www.stockcharts.com ticker JPM)
JPMorgan is a traditional bank, Click here for the full Investment Thesis.

JPMorgan reports earnings July 14.
Money Flow Index: (80 indicates ‘Overbought’ 20 indicates ‘Oversold’): current 42 is neutral but is in an uptrend with lots of room to move upwards.
MACD Momentum: Need to see the BLACK line turn upwards and cross above the RED line as a BUY signal.
On Balance Volume (OBV): (indicates whether institutions are accumulating or selling shares): Shares are being accumulated by institutions.
Volume by Price (Black/Red bars on the charts left side): Indicates there has been a large volume of shares bought in the $90-$95 price range. This indicator requires more discussion.
Price is a function of Supply/Demand.
Volume by Price reflects where buyers have been buying. In the case of JPM $90-$95 represents the ‘Breakeven’ price of most investors and acts as an area of ‘Technical Support’. There have been very few people who have bought above $95 which reflects that there are few potential sellers (either profit takers or investors who just want their money back after buying higher) if the stock price moves up. So any stock price breakout will likely be rapid.
However, should the price drop below $90, there is very little support below $85.
moneywiseHQ Strategy
Accumulate shares at the low risk entry between $90-$95. maintain a STOP LOSS sell price at $88. Look to re-enter the trade on a subsequent price rise above $90.
VISA (www.stockcharts.com ticker V)

VISA reports earnings July 28, 2020.
Visa is not a traditional financial institution. It is more widely viewed as a Financial Technology company which acts as an intermediary between the lender (a bank), the consumer, and the seller. They are the ‘Toll Booth’ collecting fees for money flow in a financial transaction.
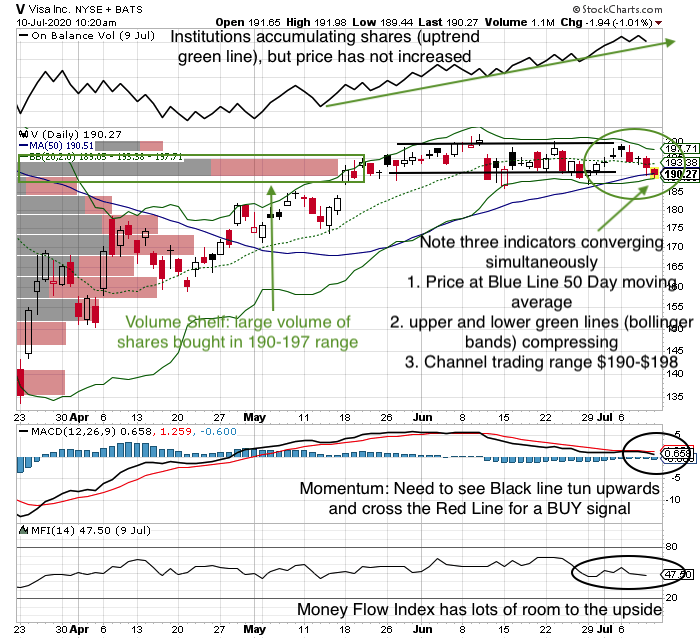
Money Flow Index: (80 indicates ‘Overbought’ 20 indicates ‘Oversold’): current 47 is neutral but with lots of room to move upwards.
MACD Momentum: Need to see the BLACK line turn upwards and cross above the RED line as a BUY signal.
On Balance Volume (OBV): (indicates whether institutions are accumulating or selling shares): Shares are being accumulated by institutions in a very strong uptrend.
Volume by Price (Black/Red bars on the charts left side): Indicates there has been a large volume of shares bought in the $190-$195 price range. This indicator requires more discussion and is very similar to JPMorgans chart.
Volume by Price reflects where buyers have been buying. In the case of V $190-$195 represents the ‘Breakeven’ price of most investors and acts as an area of ‘Technical Support’. There have been very few people who have bought above $195 which reflects that there are few potential sellers (either profit takers or investors who just want their money back after buying higher) if the stock price moves up. So any stock price breakout will likely be rapid.
However, should the price drop below $185, there is very little support below $185 until $170.
There are three important indicators which are converging. Generally such a convergence signals an impending move up or down.
- BLUE line 50 Day Moving average – This generally acts as an area of Technical Support.
- Upper and Lower green lines (Bollinger Bands) compressing
is called a ‘Volatility Squeeze’ which causes a significant move. - Channel trading range between $190-$195 – eventually the stock price will move out of this channel and establish a new trading range/pattern.
moneywiseHQ Strategy
Accumulate shares at the low risk entry price between $190-$195. Maintain a STOP LOSS sell price near$188. Look to re-enter the trade on a subsequent price rise above $190.
GOLDMAN SACHS (www.stockcharts.com ticker GS)

Goldman Sachs reports earnings July 15, 2020.
Goldman Sachs is not a traditional bank, it is primarily an investment bank which invests money on behalf of clients and acts as an advisor to large corporate transactions such as stock market Initial Public Offerings or corporate takeovers. However, over the past three years, the company has begun to move into the retail banking sector and is the institution behind the Apple card.
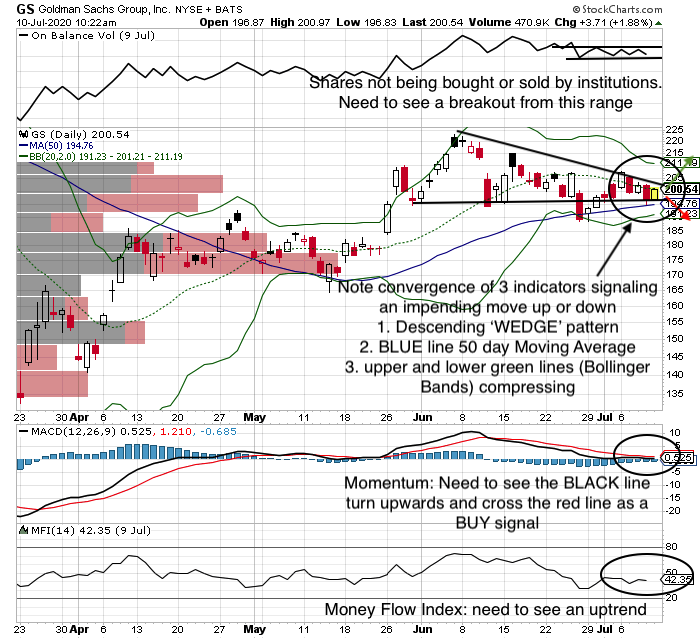
Money Flow Index: (80 indicates ‘Overbought’ 20 indicates ‘Oversold’): current 42 is neutral but with lots of room to move upwards.
MACD Momentum: Need to see the BLACK line turn upwards and cross above the RED line as a BUY signal.
On Balance Volume (OBV): (indicates whether institutions are accumulating or selling shares): OBV is in a very tight range. Shares are not being bought or sold by institutions. Stock price is a function of Supply/Demand. A breakout above this range would signal increased demand and a rising share price.
There are three important indicators which are converging. Generally, such a convergence signals an impending move up or down.
- ‘Descending Wedge Pattern’ – The Apex of this Wedge coincides with the July 15 earnings report. The stock price will break out of this wedge.
- Blue Line 50 Day moving Average – This generally acts as ‘Technical Support’ for a stock price.
- Upper and lower green lines (Bollinger Bands) are compressing which generally signals an impending move.
maneywiseHQ Strategy
Accumulate shares in the $190-$200 range. maintain a STOP LOSS sell price below $188. Look to re-enter the trade on a subsequent move above $200.
What does that mean at moneywiseHQ
In the stock market, money always has to flow between sectors. Money has been flowing into ‘the new infrastructure’ companies, those which provide the technology to generate sales in a post-
That involves money and money has to flow through banks.
JPMorgan, Visa
Stock prices have either declined or remained stagnant during the broader market recovery on two primary concerns, Government Stress Tests and Loan Losses. JPMorgan has the highest potential exposure to both, Goldman has a small exposure to loan losses through its retail banking segment called ‘Marcus’ and Visa has the lowest exposure to either of these. These risks are currently reflected in the stock prices
Based on the technical Analysis, each has a setup for a potential move higher after their earnings
Money cannot flow into one sector unless it flows out of another sector. For the financial sector to move up, another sector will have to move down. this careful balance highlights the importance of a diversified portfolio.

