In the moneywiseHQ MARKET UPDATE 10-04-2020 REACT, DON’T ANTICIPATE (click for link), we noted the headlines of 6.6 Million weekly jobless claims and a further $2.3 Trillion in financial stimulus.
The Technical Analysis reflects the Volatility Index is at an ‘Inflection Point’, The McClellan Oscillator is at a short term ‘Extreme’ level (above the ‘Sell Zone’) and the S&P500 has moved a historic 13% in five days but the On Balance Volume reflects shares have not been under accumulation by large institutions.
The fact that the market is moving up, but shares are not under accumulation by large financial institutions is a ‘divergence’, that is, they do not match up. By looking at individual stocks within the portfolio we can better assess the future direction of the market.
As we look at all of the portfolio stocks, they all follow the same pattern
- ‘W’ recovery pattern.
- Money Flow Index in an uptrend
- Momentum in an uptrend
- prices at or near ‘Technical Resistance’ levels
- Money Flow Index
This is to say that all stocks are trading in ‘correlation’, which means that all stocks in all sectors are following the same patterns. This is not a normal market behaviour. Generally stocks recover in waves over a period of time. The strongest companies with the least exposure recover first, then there is profit taking and money rotates into the next strongest group of stocks which has the best potential for recovery. then there is profit taking and money flows into the laggards.
The one pattern that is not common is the On Balance Volume. Some stocks are being accumulated by financial institutions. other are not. But they still follow the other five patterns.
For reference we use three primary indicators throughout the Portfolio Update
Money Flow Index (80 is ‘Overbought’, 20 is ‘Oversold’) at the ‘Overbought’ or ‘Oversold’ level there is a high probability of a price reversal.
MACD Momentum: indicates the price momentum. The ‘black line’ crossing over the Red Line is a ‘Buy Signal’. The ‘Black Line’ crossing below the ‘Red Line’ is a ‘Sell Signal’. The MACD crossing above the ‘ZERO’ line is a buys signal confirmation. The MACD crossing down below the ‘ZERO’ line is a sell signal confirmation.
On Balance Volume (OBV) indicates if financial institutions are accumulating or selling shares.
Technical Resistance and Technical Support define the risk/reward for any stock.
Technical Resistance: The price level that an uptrend can be expected to stop, or pause temporarily, where investors consider the stock to be fully valued and start selling shares.
Technical Support: The price level that a downtrend can be expected to stop, or pause temporarily where investors consider the stock to be undervalued and they begin buying shares.
FINANCIALS
Financials will be the first companies to reports during earnings season in the week of April 12 – April 16. Most banks suspended their buyback programs to preserve capital in response to the Covid-19 pandemic. Buyback programs generally act to provide a floor of support, or defence, against short sellers. With the US Federal Reserve now providing unlimited financial stimulus, the concerns of a repeat in bank failures seen during 2009 have largely been removed.
Money always flows and banks are the pipelines. The financial institution earnings reports will provide the best insight into the current state of the economy, the potential impact of the Covid-19 induced shutdown and the uptake by businesses and employees on the federal stimulus programs.
During a briefing, US Fed Reserve Chairman Jerome Powell expressed that he sees no reason for banks to suspend dividend payments at this time. Dividend safety provides investors with guaranteed income while waiting for a company stock price to appreciate or recover.
JPMORGAN (www.stockcharts.com ticker jpm)

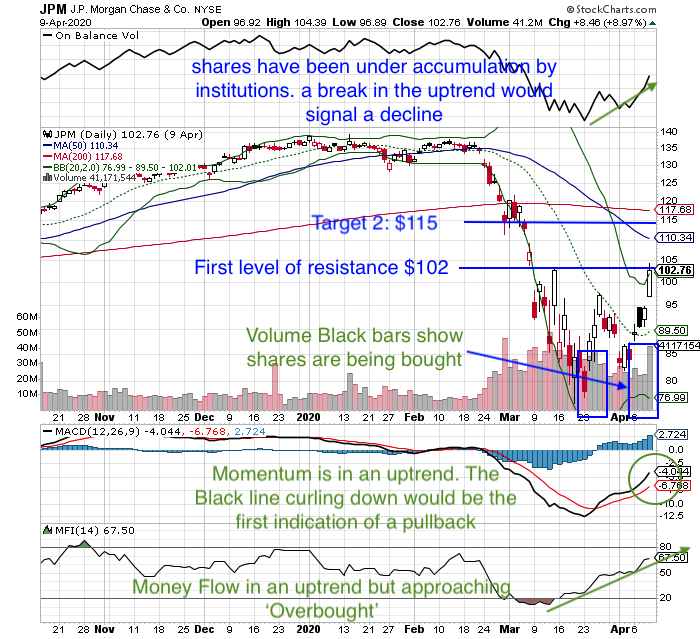
JPMorgan reports earnings Tuesday April 12. Analyst earnings estimates are for $29.5B in revenue and $2.20/share earnings. At a price of $102, the stock currently has a dividend yield of 3.5%. JPM had previously had a very large buyback program.
Money Flow Index (80 is ‘Overbought’, 20 is ‘Oversold’): Current Level 67. The MFI is in a strong uptrend but approaching the ‘Overbought’ level. A break in the uptrend would signal a price reversal.
MACD Momentum: is in an uptrend. The black line curling downwards would be the the first signal of a potential price reversal.
On Balance Volume (OBV)(indicates if financial institutions are accumulating or selling shares): OBV is in an uptrend reflecting shares are being accumulated by large financial institutions. A break in this trend would signal potential price reversal.
Volume (the polygraph of the market): the black bars indicate shares are being bought.
Technical Resistance: $102. A break above this level could see shares continue to target 2 $115. A failure at this level could see shares fall to a range of $90-$95.
Assessment: The stock price has run up into earnings. If the bank fails to meet expectations, the stock could see a pullback. However, based on the technical analysis there is still an amount of room to the upside if the conference call commentary reflects a positive trend in economic recovery.
Strategy: consider risk mitigation strategies such as a ‘Trailing Stop Loss’ sell order to maintain exposure to any further upside while protecting gains if the stock pulls back. For a more conservative approach consider trimming a portion of shares with the view towards buying them back again after the earnings report either on a breakout above $103 or a decline to $90-$95.
GOLDMAN SACHS (www.stockcharts.com ticker GS)

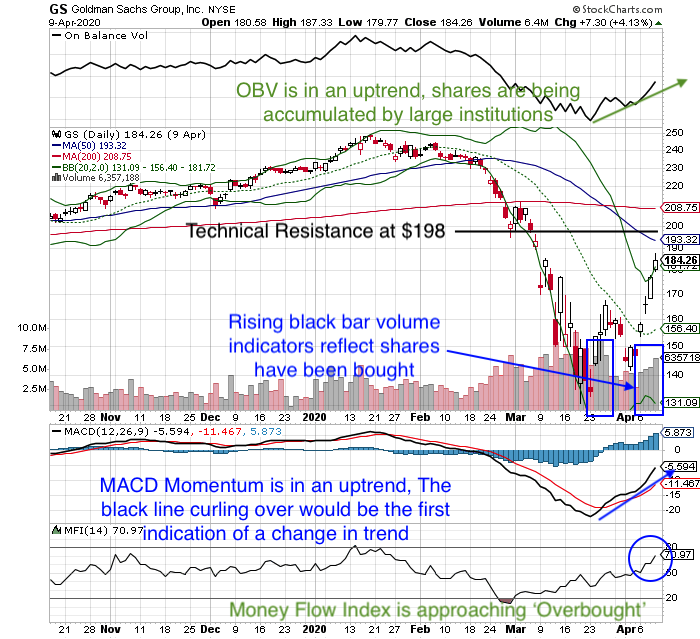
Goldman Sachs reports earnings Wednesday April 13, 2020. Analyst expectations are for $8.22B Revenue and earnings per share of $3.23. At $184 the stock provides a dividend yield of 2.7%.
Of importance will be the disclosure of Tangible Book Value (the value of only the company if only considering the assets). In Q4 2019, this was $208 reflecting the stock price is currently at a significant discount. GS makes money by leveraging investments, merger and acquisitions and bond exposure. All are subject to the macroeconomic environment and conference call commentary will provide insight into how the company is capitalizing on opportunities or navigating exposure to declines in these areas.
The stock price will move April 12 based on the JPMorgan reporting earnings a day before GS.
Money Flow Index (80 is ‘Overbought’, 20 is ‘Oversold’): Current Level 71. MFI has been in an uptrend but is approaching the ‘Overbought’ level of 80 at which point a price reversal generally occurs.
On Balance Volume (OBV)(indicates if financial institutions are accumulating or selling shares): OBV is in an uptrend reflecting shares are being accumulated by large financial institutions. A break in this trend would signal potential price reversal.
MACD Momentum: is in an uptrend. The black line curling downwards would be the the first signal of a potential price reversal.
Volume (the polygraph of the market): the black bars indicate shares are being bought.
Technical Resistance: $198. A break above this level could see shares continue to the company Tangible Book Value. A failure at this level could see shares fall to a range of $150-$160.
Assessment: The stock price has run up into earnings. If the bank fails to meet expectations, the stock could see a pullback. However, based on the technical analysis there is still an amount of room to the upside. The upside reward is to $195 (+7%), the downside risk is to $150-$160 (-20%).
Strategy: consider risk mitigation strategies such as a ‘Trailing Stop Loss’ sell order to maintain exposure to any further upside while protecting gains if the stock pulls back. For a more conservative approach, consider trimming shares between $183 – $195 with the view towards buying them back again after the report either on a breakout above $198 or a decline to $150-$160.
TECHNOLOGY
APPLE (www.stockcharts.com ticker AAPL)

Apple reports earnings April 30, 2020. Until that time, Apple may trade based on headlines of potential social distancing restriction being eased, the potential of store re-openings and employment increasing as laid off workers are called back throughout the economy.
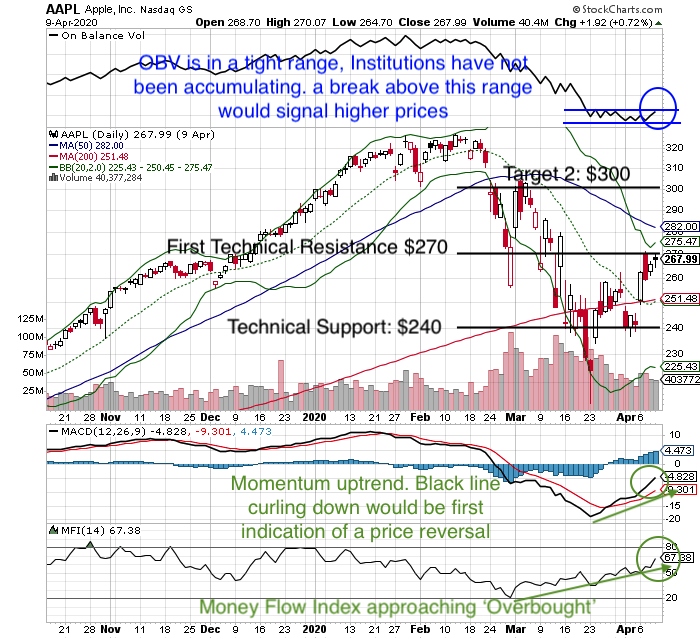
Assessment: Money Flow, Momentum and stock price have all been in an uptrend. This is a divergence from the OBV which indicates institutions have not been re-accumulating shares after aggressively selling them in March. This would be an ‘Inflection Point’. In order for the stock price to move up, Financial Institutions are going to have to start accumulating shares.
Technical Resistance is at $270. If the price pulls back it should find Technical Support (downside risk) at $240. If the price breaks above $270, the upside reward is to $300.
Strategy: Apple is a great stock for holding over the long term. For investors concerned with the short term, consider a ‘Trailing Stop Loss’ order as prices rise to protect recent gains with the view towards buying them back lower. If OBV breaks out above the narrow range, signalling institutional buying, begin accumulating shares with a ‘Stop Loss’ at $270.
CYCLICAL CONSUMER GOODS AND SERVICES
DISNEY (www.stockcharts.com ticker DIS)

Disney announced Disney+ streaming subscribers of 50 Million on April 8 causing a spike in the stock price. Although this is a very positive development for the company, it has to be remembered that the theme parks are closed, Disney cruise ships are docked, and movie release dates have been pushed back by at least six months. When the economy re-opens Disney will see a strong recovery from pent up demand.
Disney releases earnings between May 8 – May 13.
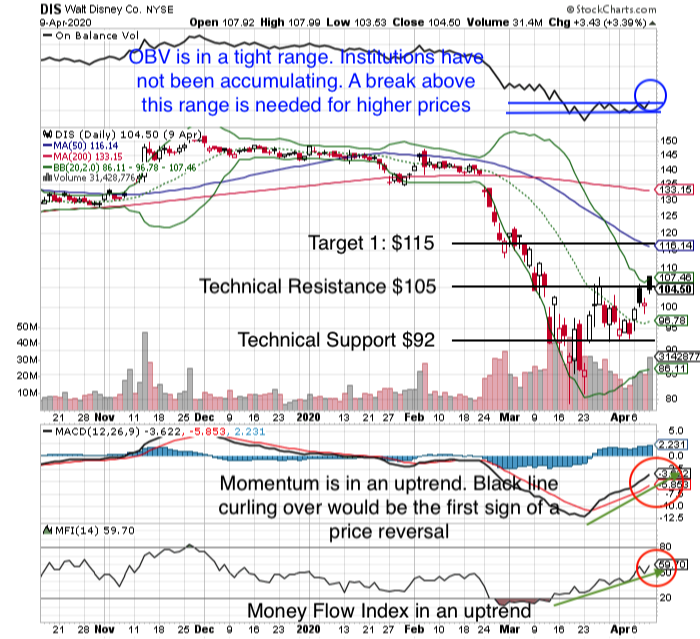
Money Flow, Momentum and stock price have all been in an uptrend. This is a divergence from the OBV which indicates institutions have not been re-accumulating shares after aggressively selling them in March. This would be an ‘Inflection Point’. In order for the stock price to move up, Financial Institutions are going to have to start accumulating shares.
Technical Resistance is at $105. If the price pulls back it should find Technical Support (downside risk) at $92. If the price breaks above $105, Target 1 (upside reward) is to $115.
Strategy: Disney is a great stock for holding over the long term, in the short term, the largest revenue streams have been shut down. For investors concerned with the short term, consider a ‘Trailing Stop Loss’ order as prices rise to protect recent gains with the view towards buying them back lower. If OBV breaks out above the narrow range, signalling institutional buying, begin accumulating shares with a ‘Stop Loss’ at $105.

