TESLA (TSLA) TECHNICAL ANALYSIS
- Tesla has a number of catalysts withi;the upcoming year which will boost sales volumes.
- There is one imminent threat, the maturing of issued bonds in March.
- The stock is entering a convergence of two powerful technical patterns simultaneously indicating an impending powerful move.

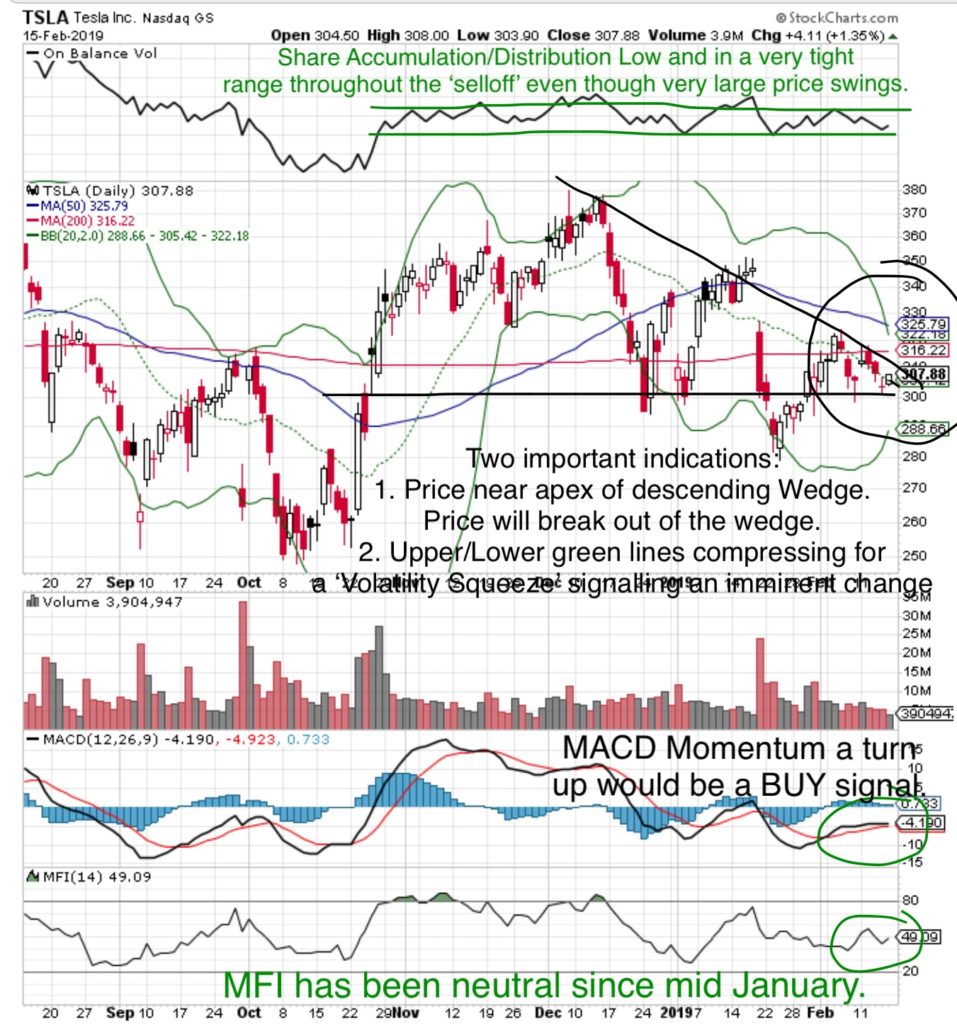
Money Flow Index (80 is Overbought, 20 is Oversold) – at 49, the MFI is Neutral reflecting room to the upside. A selloff to near 20 from a neutral level would likely have limited downside corresponding to a price near $280. The MFI has been neutral since mid January even though the stock price has fluctuated within a $50 range.
MACD Momentum – is flat but in an uptrend and the Black and Red Lines are even. The Black Line curling upwards would be a BUY signal, down a SELL signal.
On Balance Volume (OBV indicates share accumulation/distribution) – the OBV has traded within a very tight range with selling pressure equally balancing buying. This has been steady since November 1, even though the stock price has traded between $280-$375. The reading is currently near the bottom of the range reflecting limited supply in the event of a selloff.
There are two powerful Technical Patterns developing.
- A Descending Wedge – defined by Technical Support near $300, and a series of ‘Lower Highs’. The stock price is currently near the apex of this wedge. The stock price will break out of this wedge either up or down.
- The Upper and Lower Bollinger Bands (Green Lines on the chart) – are compressing to form a ‘Volatility Squeeze’ which signals an impending price movement, either up or down.
What does that mean at MONEYWISEHQ
This stock is about to make a move, it just needs a catalyst..
In the short term, Tesla faces a maturing debt obligation in March. If the shares are at a price of $360, bond holders can convert the bonds to shares or to a cash payment. If the shares do not reach that price, Tesla will have to make a cash payment in the amount of $920M. In the latest earnings report, Elon Musk started the company had $3.2B cash on hand and enough to pay the bonds if required. A conversion from bonds to shares will hav3 the effect of diluting the share count, which will affect stock price.
In the long term, the company will announce a truck in the summer, begin production of a Model Y SUV in 2019, begin deliveries to Europe in Q1 2019, has started building a production factory in China with plans to start production by end of year 2019 which the company expects will take production current levels near 5500/week to 10,000/week. Chinese production would also lower ‘made in China’ vehicle costs for local delivery.
Tesla has been a ‘Short Sellers’ stock for years. The Bear Market of October 2019 was a perfectly engineered setup for computer algorithm and short selling, and that has to be monitored. Most generally there would be a pullback in the market to form some kind of ‘retest’ or establish a ‘higher low’. This is what most traders are positioned for.
It’s important to be aware of the potential for short selling setups.
The consistent OBV in a low and tight range, combined with a neutral MFI, slowly uptrending MACD Momentum still below the ‘Zero’ line, and a Technical Support Level at $300 and then the next level at $280 does not seem like a setup for a large short selling program.
The descending Wedge and approaching Volatility Squeeze signal a move is coming which would follow one of two scenarios;
- It is possible that the stock price might be ‘goosed’ up to $360 so that the company doesn’t have to pay the debt obligation, or
- the stock might be sold short forcing it down so the company does have to pay the $920M cash, which would affect the balance sheet and likely force the stock lower.
Price is a function of Supply/Demand. The low OBV and MFI reflect limited Supply and the low Momentum does not reflect a ‘run up’ which would be sold off. The OBV and MFI levels dropping to ‘Oversold’ levels might correspond near a downside risk of $280 which has been a long term secondary Technical Support Level.
Downside Risk: $300 then $280 (7%)
Upside Reward: $320-330 then $360 (10-20%)
In the long term, the potential to double production and corresponding revenues is a difficult catalyst for short sellers to bet against.
Strategy:
- wait for a breakout above the ‘Wedge’ to a price near $315 and maintain a Trailing Stop Loss as a percent between 1-3%, or
- Accumulate near the low risk entry price of $300. Maintain a disciplined STOP LOSS price near $298 with the view to repurchase near $280 or a subsequent rise above $300.
