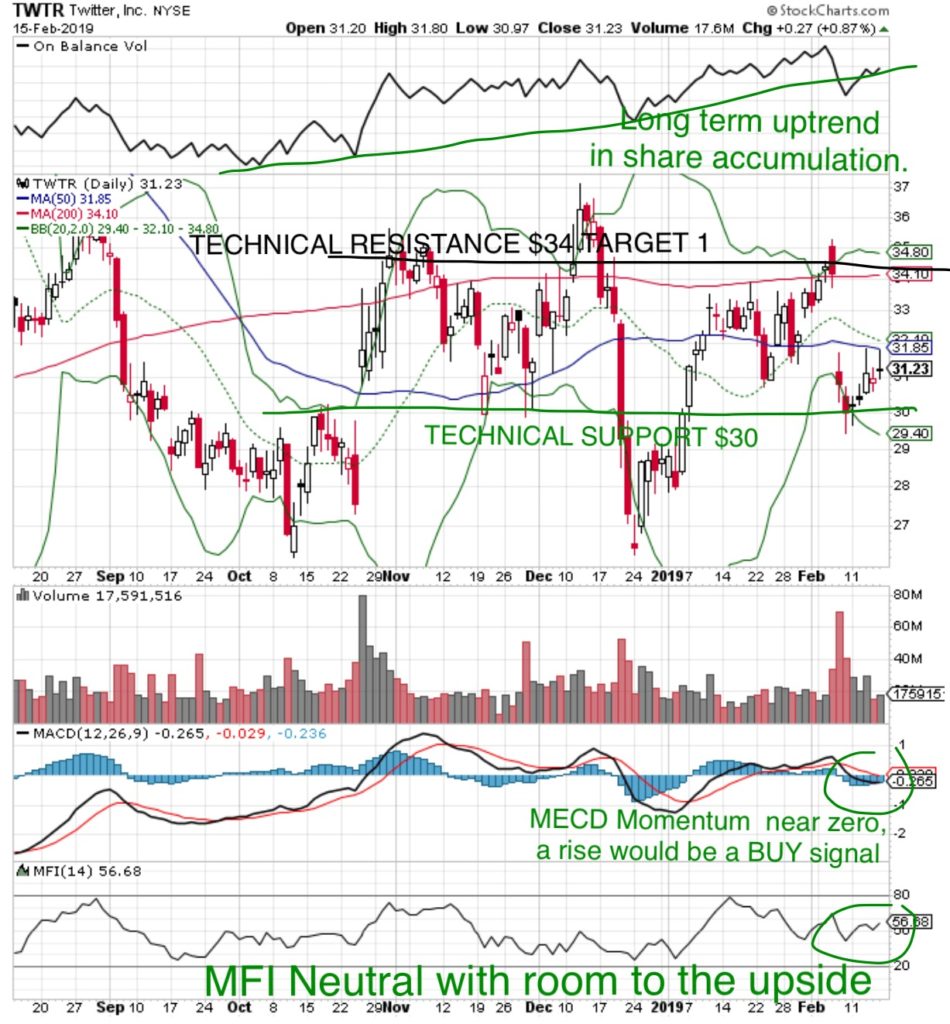
- Twitter is setting up for profitability through an effective Channel Trading strategy.
- The stock price was set up in a Pattern 1 Earnings trade which resulted in the stock price selling off, and s buying opportunity.

Money Flow Index (80 is Overbought, 20 is Oversold) – 56 is Neutral after a post earnings sell off.
On Balance Volume (OBV indicates share accumulation/distribution) – accumulation after a post earnings sell off. There has been a long term uptrend even through the December Bear Market.
MACD Momentum – a curl upwards would be a BUY signal, a cross above the ‘ZERO’ line would be a confirmation of a BUY.
Trading Channel – is well defined between a Technical Support level of $30 and Technical Resistance of $34.50.
Downside Risk: $30 (4%) then down to $28 (10%)
Upside Reward: $34.50 (10%) then up to $37 (18%)
What does that mean at MONEYWISEHQ
The Twitter Earnings Report beat analyst expectations on both revenue and earnings but the stock sold off in response to guidance of increased costs and lower revenue.
Earnings season market action follows one of three patterns
- Stocks run up in anticipation of strong results, then selloff when earnings don’t meet high expectations.
- Stocks remain neutral until the release then either move up or down based on the actual results
- Stocks decline as a selloff due to uncertainty of the results, then climb when results are not as bad as expected.
Leading into the Earnings Report Twitter was set up for a Pattern 1, running up to Technical Resistance near $35. The consistent response to any company which has provided lowered guidance has been a selloff.
A market recovery occurs in three waves. The strongest stocks recover first. When these reach a fully valued level, profits are taken and the leaders are used as a source of funds rotating into strong companies which have lagged the market but offer the greatest potential upside. When these stocks reach a fully valued level, funds are rotated into the weakest of stocks.
The possibility of a broader market pullback remains with the overhang of US/China trade negotiations coincident with long term market timing of a selloff in the final week of each month. A 3-5% pullback would be considered ‘healthy’ and create buying opportunities, however, when everyone is expecting the same move, sometimes it doesn’t happen.
Minimizing risk is important, which means looking for stocks which fit a formula
- Technical Indicators – Money Flow Index in an uptrend from a low level, On Balance Volume showing share accumulation, MACD Momentum providing uptrend potential, stock price at or near a Technical Support level.
- An established or predictable trading pattern such as a Trading Channel or Volatility Squeeze.
- Strong Investment Thesis, but the stock has not participated in the broader market recover.
Twitter appears to fit this formula, however a disciplined strategy must be maintained.
STRATEGY
1. Channel Trade – Accumulate shares in the $30 – $31 range, sell near $34 within the Channel. Maintain a STOP LOSS sell price near $29.50.
