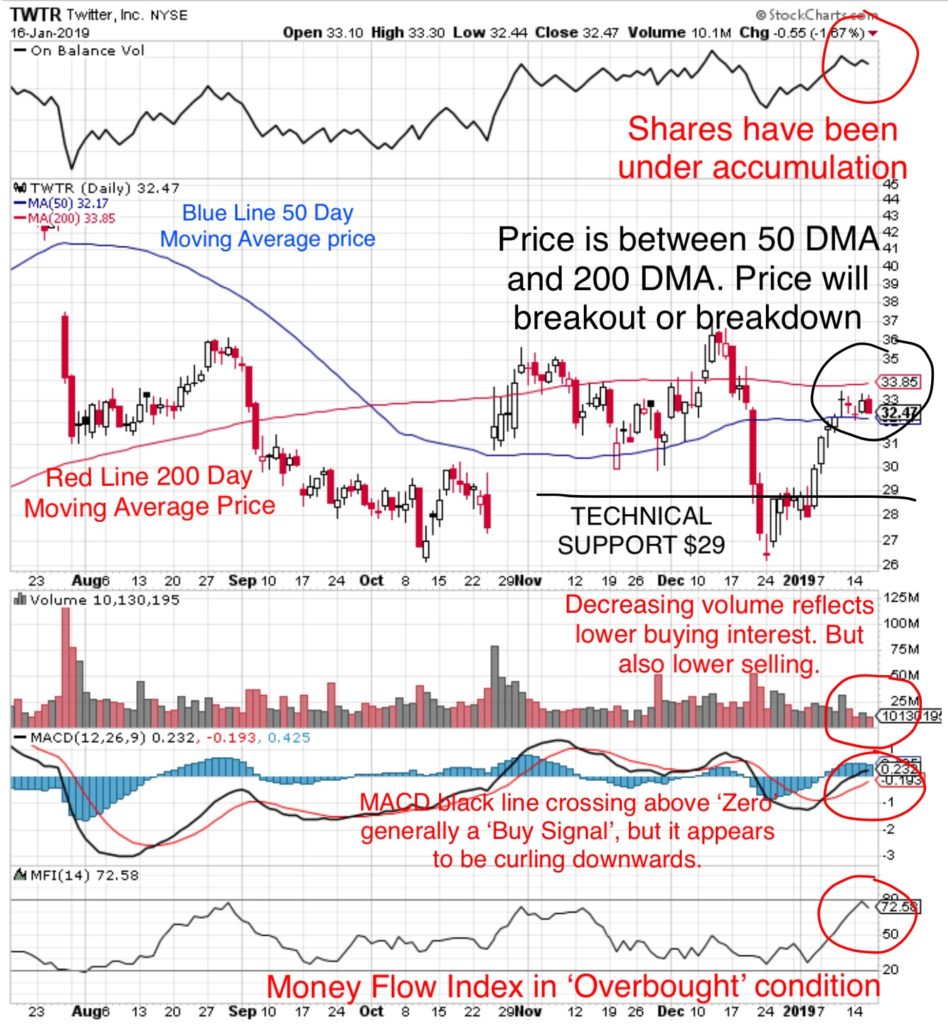
- Twitter has low China exposure or US Interest Rate sensitivity which has provided exception stability in the face of the recent stock market turmoil.
- The stock price is limited by the short term upside reward vs the higher downside risk.

Money Flow Index (20 is Oversold, 80 is Overbought): at 72 the index is high and has begun to turn downwards. It is possible the index may be skewed by the severe December selloff.
MACD Momentum: has crossed above the ‘Zero’ line which is generally considered a ‘Buy’ signal.
Volume: in the past 5 sessions volume has decreased to the lowest levels in the past six months reflecting a lack of willingness of buyers to commit to buying.
On Balance Volume (accumulation/distribution): shares have been accumulated and have reached a high level and have begun to be sold.this confirms the lack of buying interest by investors.
Price: is situated between the 50 and 200 Day Moving Averages. The stock price will either breakout or breakdown.
TECHNICAL SUPPORT: $29
TARGET 1: $35
What does that mean at MONEYWISEHQ
There is about 5% upside reward and 15% downside risk.
A significant catalyst would be required to cause a breakout above the long term established technical resistance of $35.
The question has to be considered, if investors weren’t willing to pay more than $35 in September during the stock market price and stability peak, why would they pay more in a high volatility and high risk environment?
The next Catalyst is
- Earnings report due January 7
Twitter is in a high risk position. Having low Chinese and Interest rate exposure is a strength, however, any trade war resolution will have limited benefit as a catalyst and the main driver of share price will be the earnings report and forward guidance.
Earnings season market action follows one of three patterns
- Stocks run up in anticipation of strong results, then selloff when earnings don’t meet high expectations.
- Stocks remain neutral until the release then either move up or down based on the actual results
- Stocks decline as a selloff due to uncertainty of the results, then climb when results are not as bad as expected.
It’s important to take a look at the technical analysis of each of the stocks in the portfolio and compare them against those three patterns, taking a defensive strategy to protect the recovery gains recently made.
The next 14 days before the TWTR earnings report will determine the pattern, it’s important to be prepared if an opportunity presents itself.
Strategy: 1. for current positions place a Stop Loss near $32
2. Consider waiting for a pullback near $29 and a setup for pattern #2 or #3
